Comparisons
CoLoop Benchmark Report
An evaluation framework built to measure and improve agent performance on real-world qualitative research work.
Jack Bowen, Co-Founder & CEO · · 5 minutes read
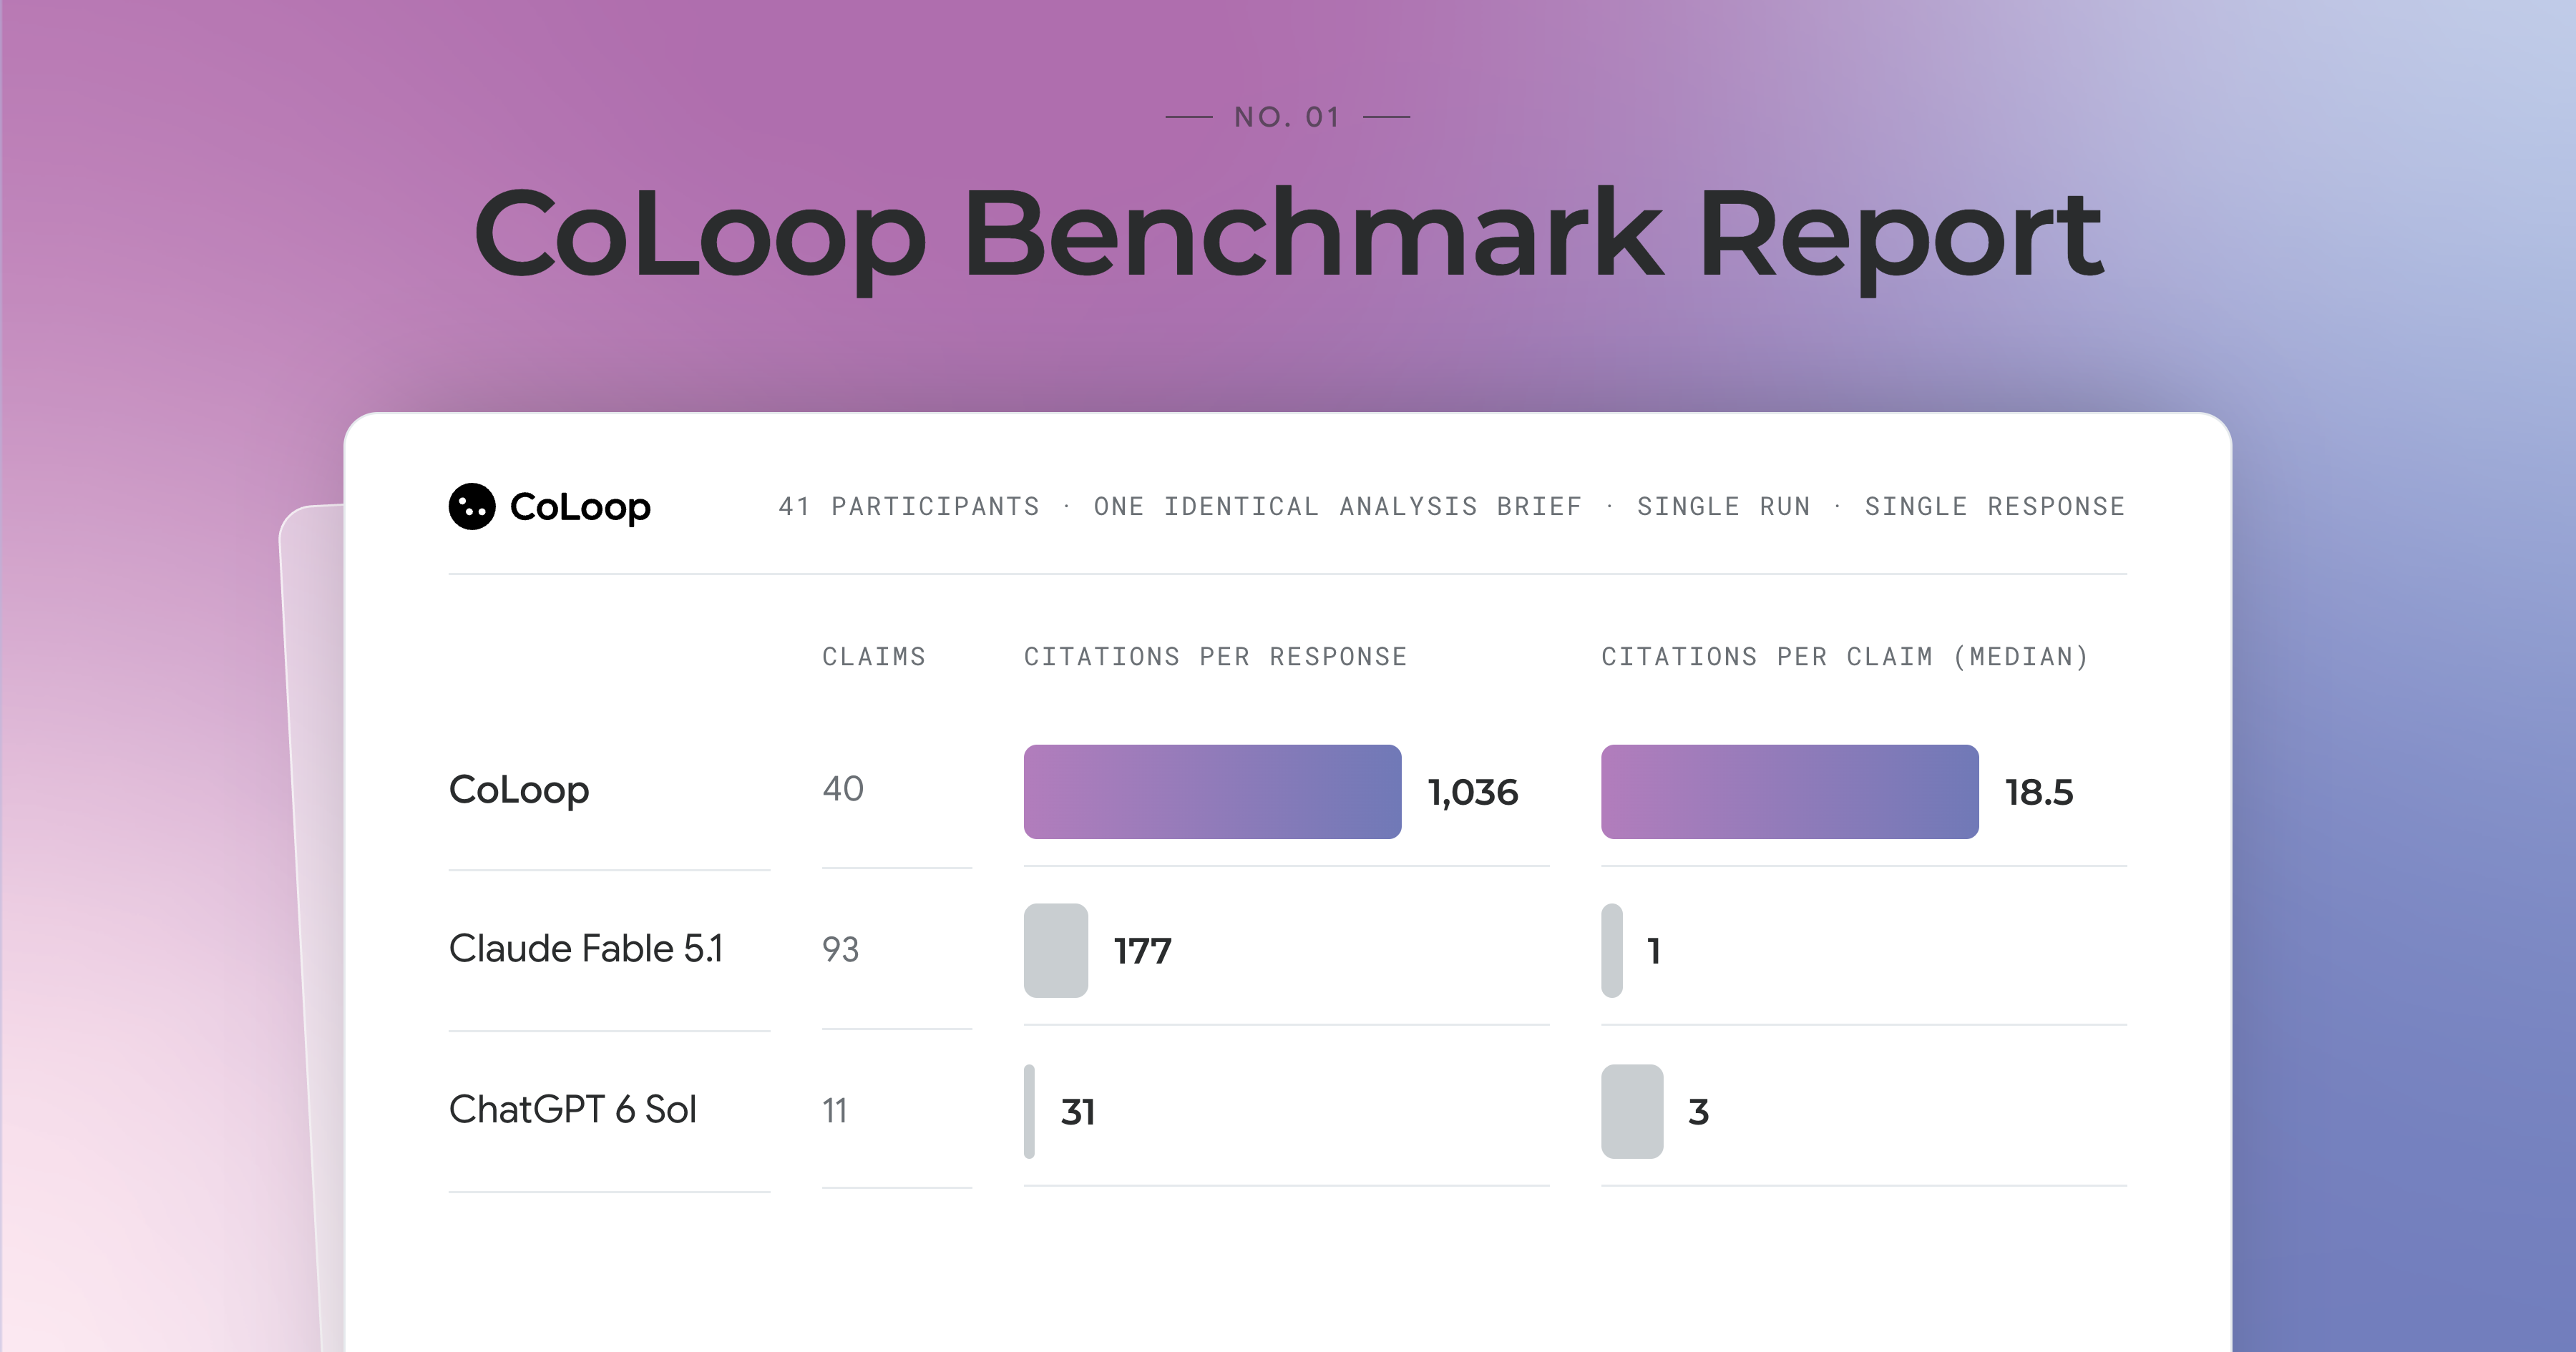
We built CoLoop Research Eval, an internal benchmark for evaluating agents on the complex, evidence-heavy work that qualitative research actually demands. CoLoop Research Eval was built to evaluate and improve our agents' ability to support researchers.
CoLoop's Thought Partner Chat outperforms leading foundation models on qualitative research specific tasks.
Existing AI evaluations and agent benchmarks have been useful for tracking general LLM capability, but they fall short of the rigor required for qualitative research. When improving our analysis AI, we needed a fast, standardised way to measure the performance. Just like the rubrics senior researchers apply before a deliverable goes out the door.
To bridge that gap, we built an evaluation framework that mirrors how senior researchers actually review research work against the underlying qualitative data. Insight accuracy is tested across three layers:
- Citation strength,
- Participant coverage,
- Prevalence calibration.
How CoLoop Eval mirrors the researcher review process
Before a deliverable reaches a stakeholder, a senior researcher reviews it. They ask questions to make sure each insight is defendable, and they dip into the raw data whenever something needs closer scrutiny.
CoLoop Research Eval encodes that review.
We have dozens of internal evals to improve our agents' analysis quality; the three layers and five rubrics we're launching here, map most directly to the questions a director asks of a deliverable.
| Layer | The director's question | Rubrics | What we measure |
|---|---|---|---|
| 1. Citation Strength | Is the insight correct? | 1a. Citation depth 1b. Citation quality | How much evidence supports each claim and how strongly each citation supports the claim |
| 2. Participant Coverage | Did we miss anyone? Is the insight biased? | 2a. Coverage 2b. Distribution | Whether every participant in the sample is heard, and whether a few dominate the evidence |
| 3. Prevalence Calibration | Is this insight important? | 3. Calibration | Whether "most," "many," and "26 of 41" match the participants actually cited for the claim |
The Test
We've run these tests across hundreds of projects to improve Thought Partner Chat.
Here's a worked example using data from one of these tests:
41 AI-moderated in-depth interviews were conducted with working professionals about how AI fits into their working day.
Three tools, CoLoop's Thought Partner Chat, Claude Fable 5.1 (high effort), and ChatGPT 6 Sol (high effort), received the same 41 transcripts and an identical analysis brief each in a single run, with no re-rolls.
The three responses differ in: the length, the number of claims and the number of citations. Each response, claim and citation, was graded by the CoLoop Research Eval judge on 6 October 2026.
Response time
Response time is not scored by CoLoop Research Eval, but it matters to researchers: analysis is iterative, and a researcher interrogates a dataset dozens of times before an AI claim becomes an insight in the final report.
On the same run, CoLoop's Thought Partner Chat returned its response in 3 minutes, ChatGPT 6 Sol (high effort) in 8 minutes, and Claude Fable 5.1 (high effort) in 12 minutes.
We also ran ChatGPT 6 Astra (pro) and excluded it from the comparison: at over 40 minutes per response, it is not a viable tool for interrogating data question by question.
Benchmark Layer 1. Citation Strength
Is the insight correct?
The first layer of CoLoop Research Eval tests the integrity of every individual statement. The question it answers is simple: does this claim reflect what participants actually said, and how much evidence is there to prove it?
This mirrors the first action a senior researcher takes when reviewing a team member's work. They trace claims back to the detailed evidence: content analysis tables, coding grids, the transcripts themselves, because that is the path back to the participant who actually said the thing.
Citation Strength encodes that judgment in two rubrics.
Rubric 1a. Citation depth: how much evidence backs each claim. For every claim, we count the citations attached to it and the number of distinct participants they draw on. This measures whether the agent is actually showing its evidence or just decorating its prose.
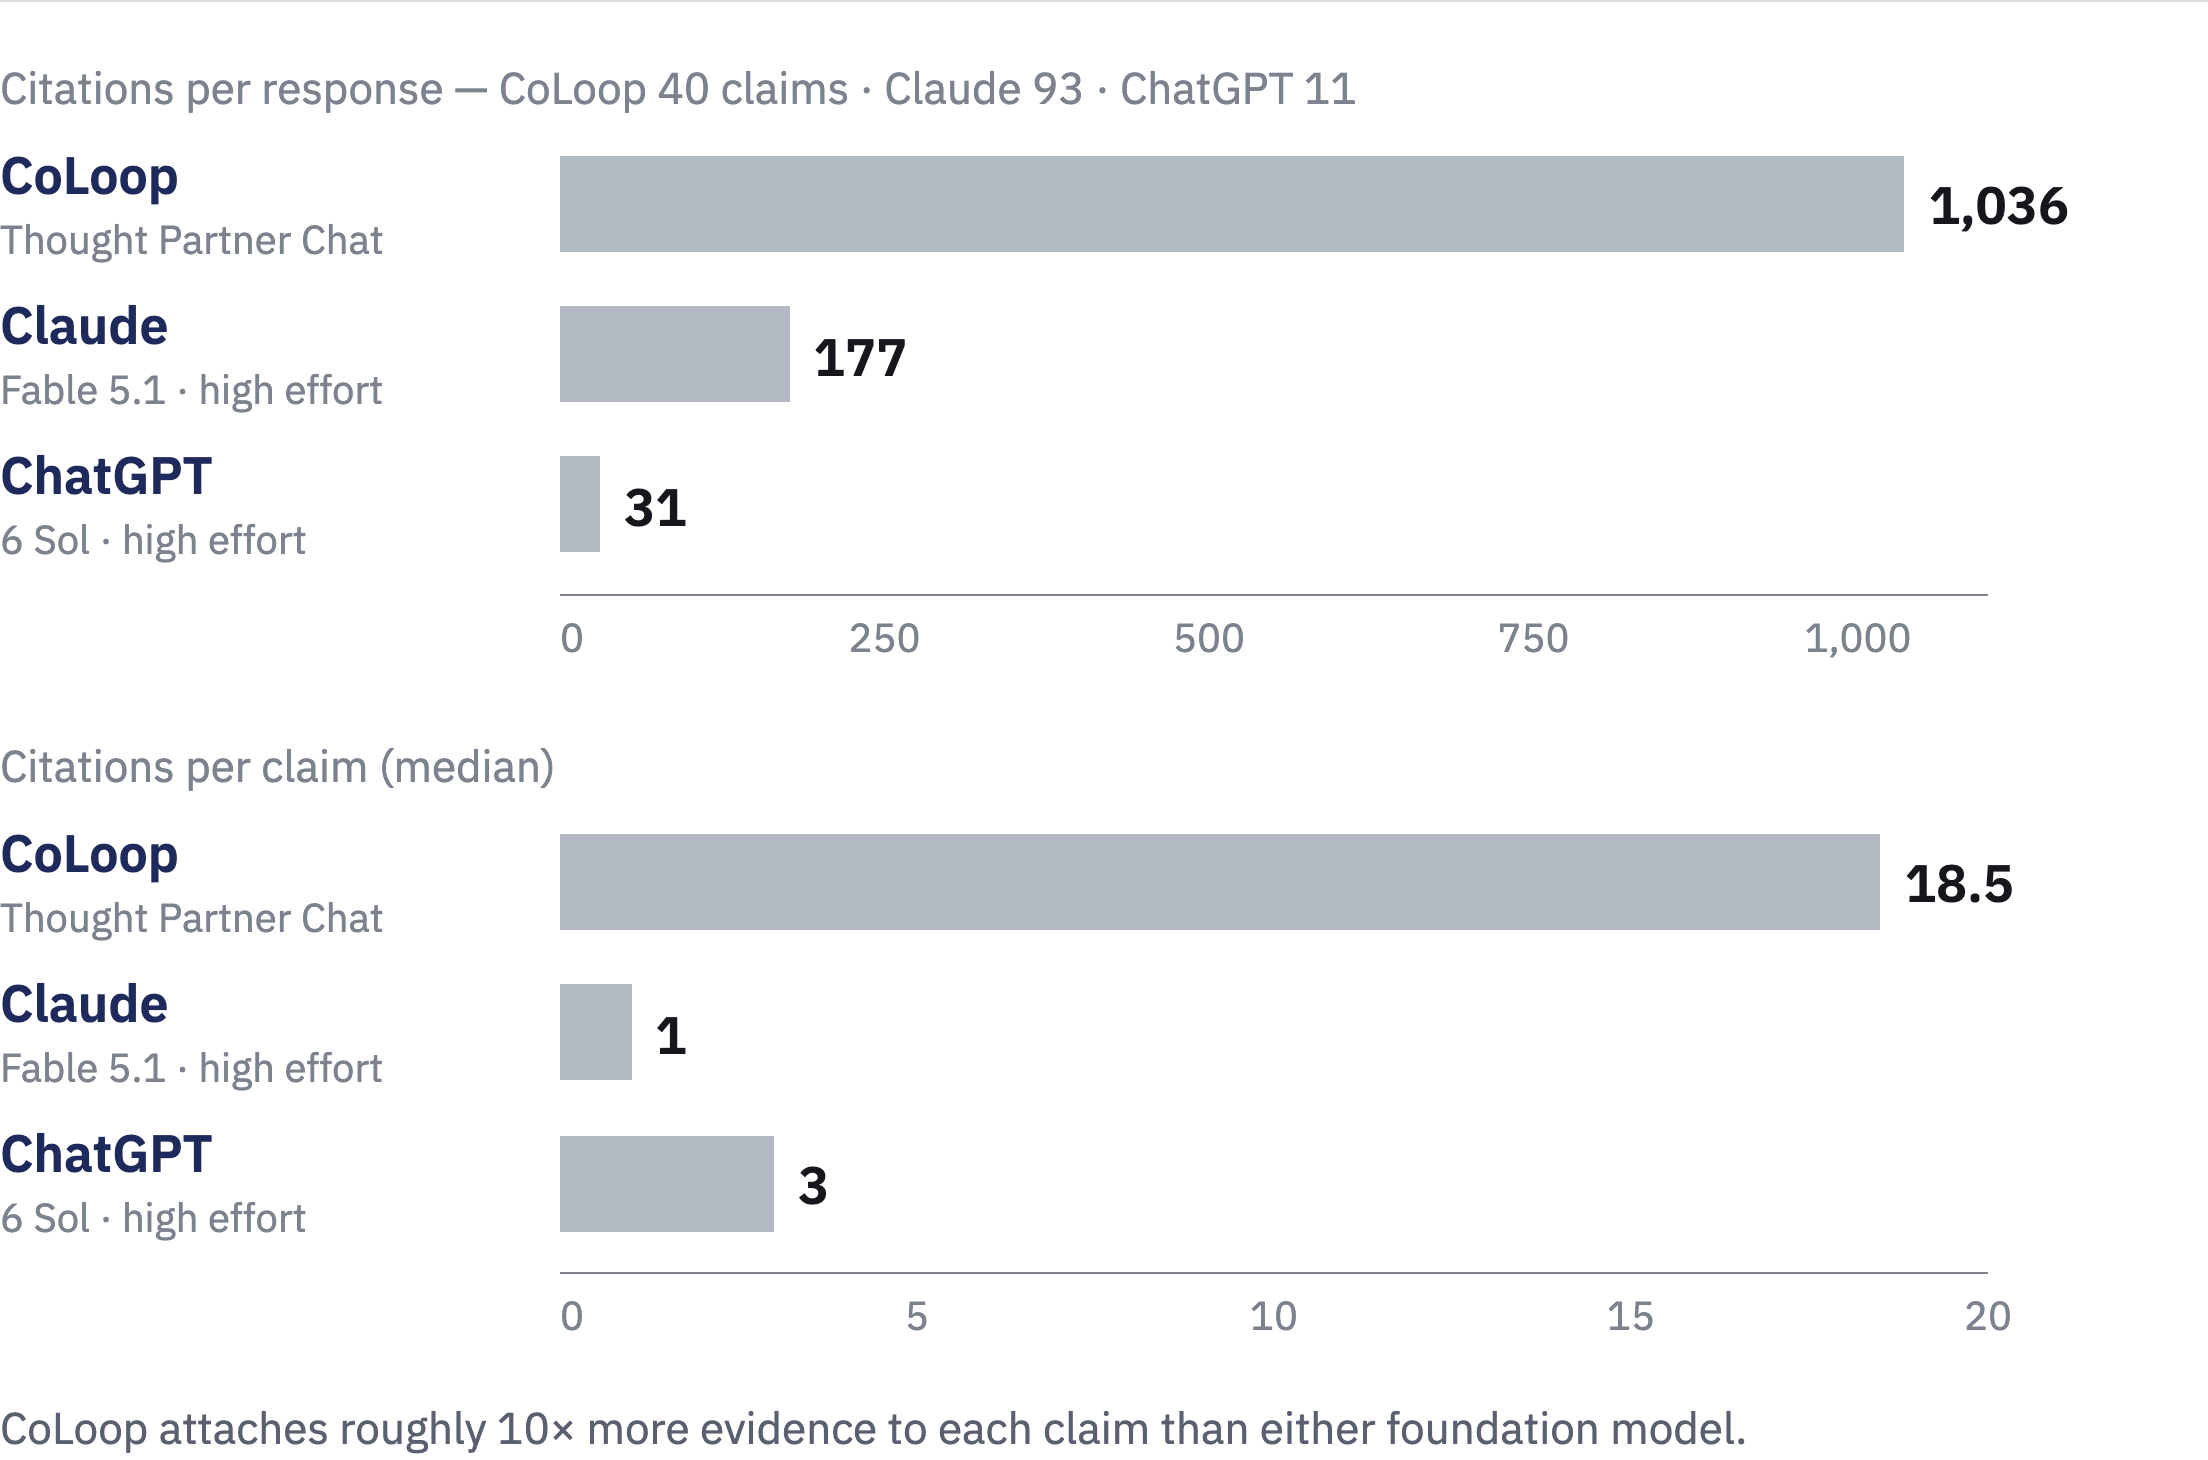
A typical claim from the generic tools rests on one to three citations; the average CoLoop claim rests on eighteen citations.
In our example response, all three tools identified the same headline pattern: professionals use AI for everyday writing. CoLoop cited 26 participants for this claim, Claude Fable 5.1 cited 4, and ChatGPT 6 Sol cited 3.
As participant context increased, CoLoop's response became more nuanced. It separated the pattern into reasons: "I need this to sound right" (tone, professionalism), "This is taking too much time or effort," and "There is too much material to process." Meanwhile, the generic tools described the pattern in a more generalised and flattened way: "make an email professional, remove emotion, fix grammar, hit a character limit."
Rubric 1b. Citation quality: how directly each citation supports its claim. Every citation is graded on a five-point scale, from Strong through three Moderate grades to Weak, according to how directly the quoted passage supports the claim it is attached to.
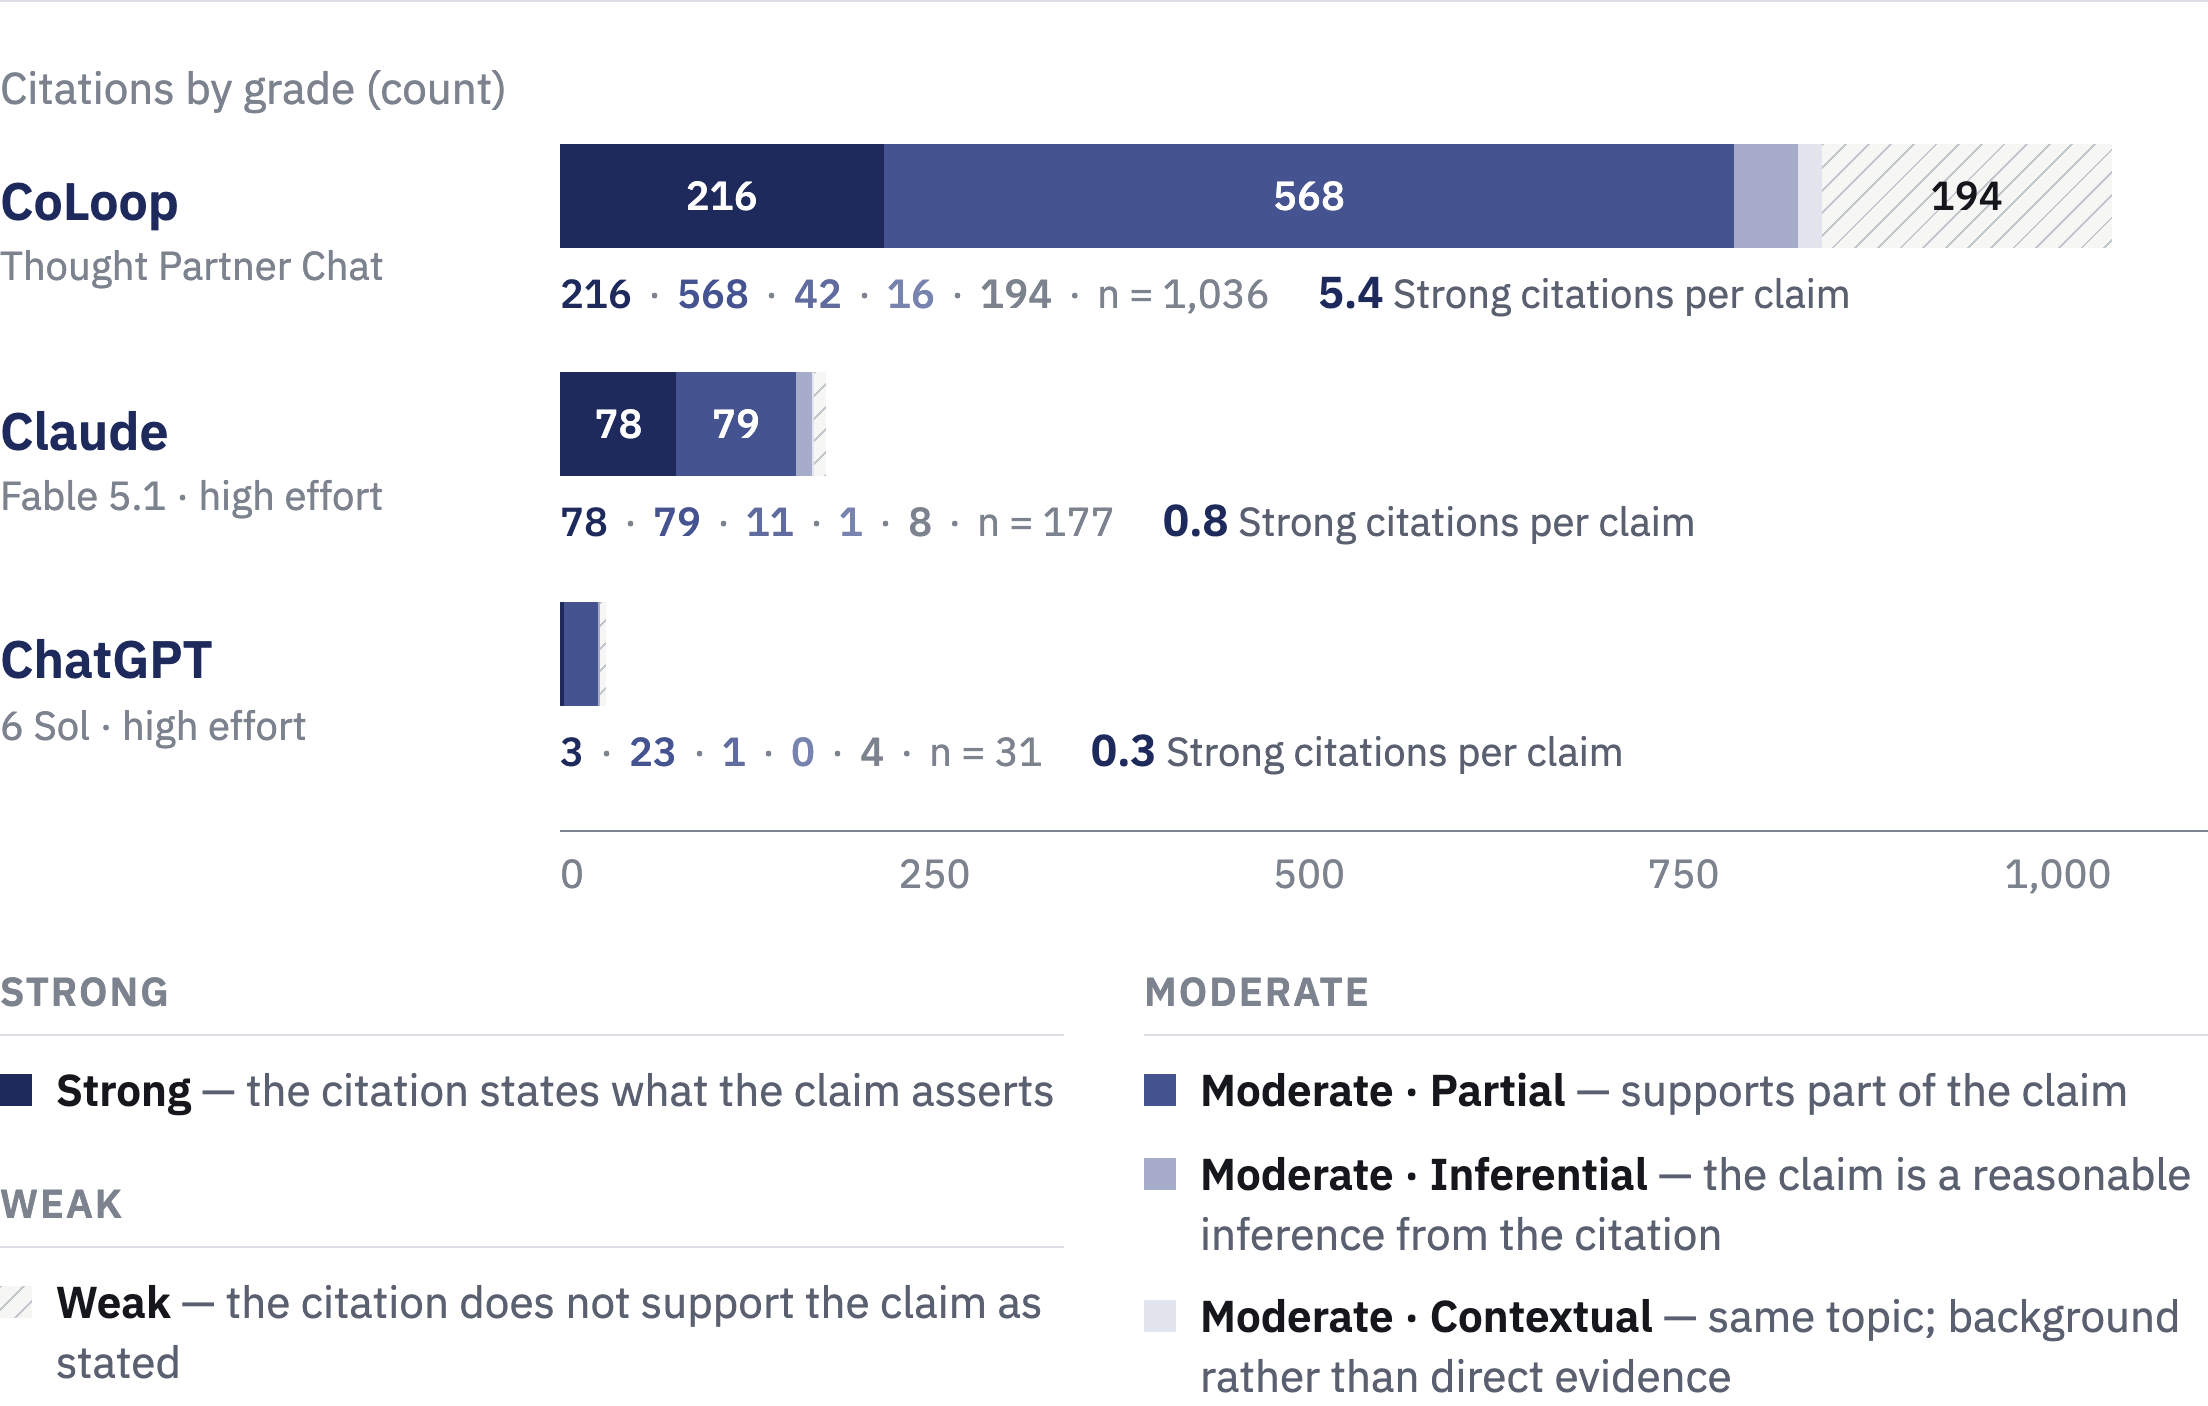
CoLoop's agent cites the context it reasons over, not only the quotes that confirm a claim, so a share of its citations grade as Weak. Most of the quotes sit on a few claims: four such claims account for 125 of the 194 quotes
Example:
"Overall AI usage and task-specific AI usage are not interchangeable," carries 47 citations. Each cited passage describes what one participant uses AI for; none of them state the distinction that the claim draws, so the judge grades them as not supporting the claim directly. Read individually, they are background rather than evidence; read together, they are the dataset from which the claim was derived.
Benchmark Layer 2. Participant Coverage
Did we miss anyone? Is the insight unbiased?
Coverage ensures the analysis honours the full sample and surfaces both the minority and contradictory perspectives that carry the strategic value of qualitative research.
The Participant Coverage evaluation mirrors the sample completeness and representativeness check. In a real review, senior researchers lean on respondent grids and content analysis tables as the foundation for making sure no voice is misrepresented and no insight is biased.
They ask: Did we miss anyone? Did we over-weight a small subset?
Participant Coverage encodes those two questions as two rubrics.
Rubric 2a. Coverage: how much of each participant's input is used.
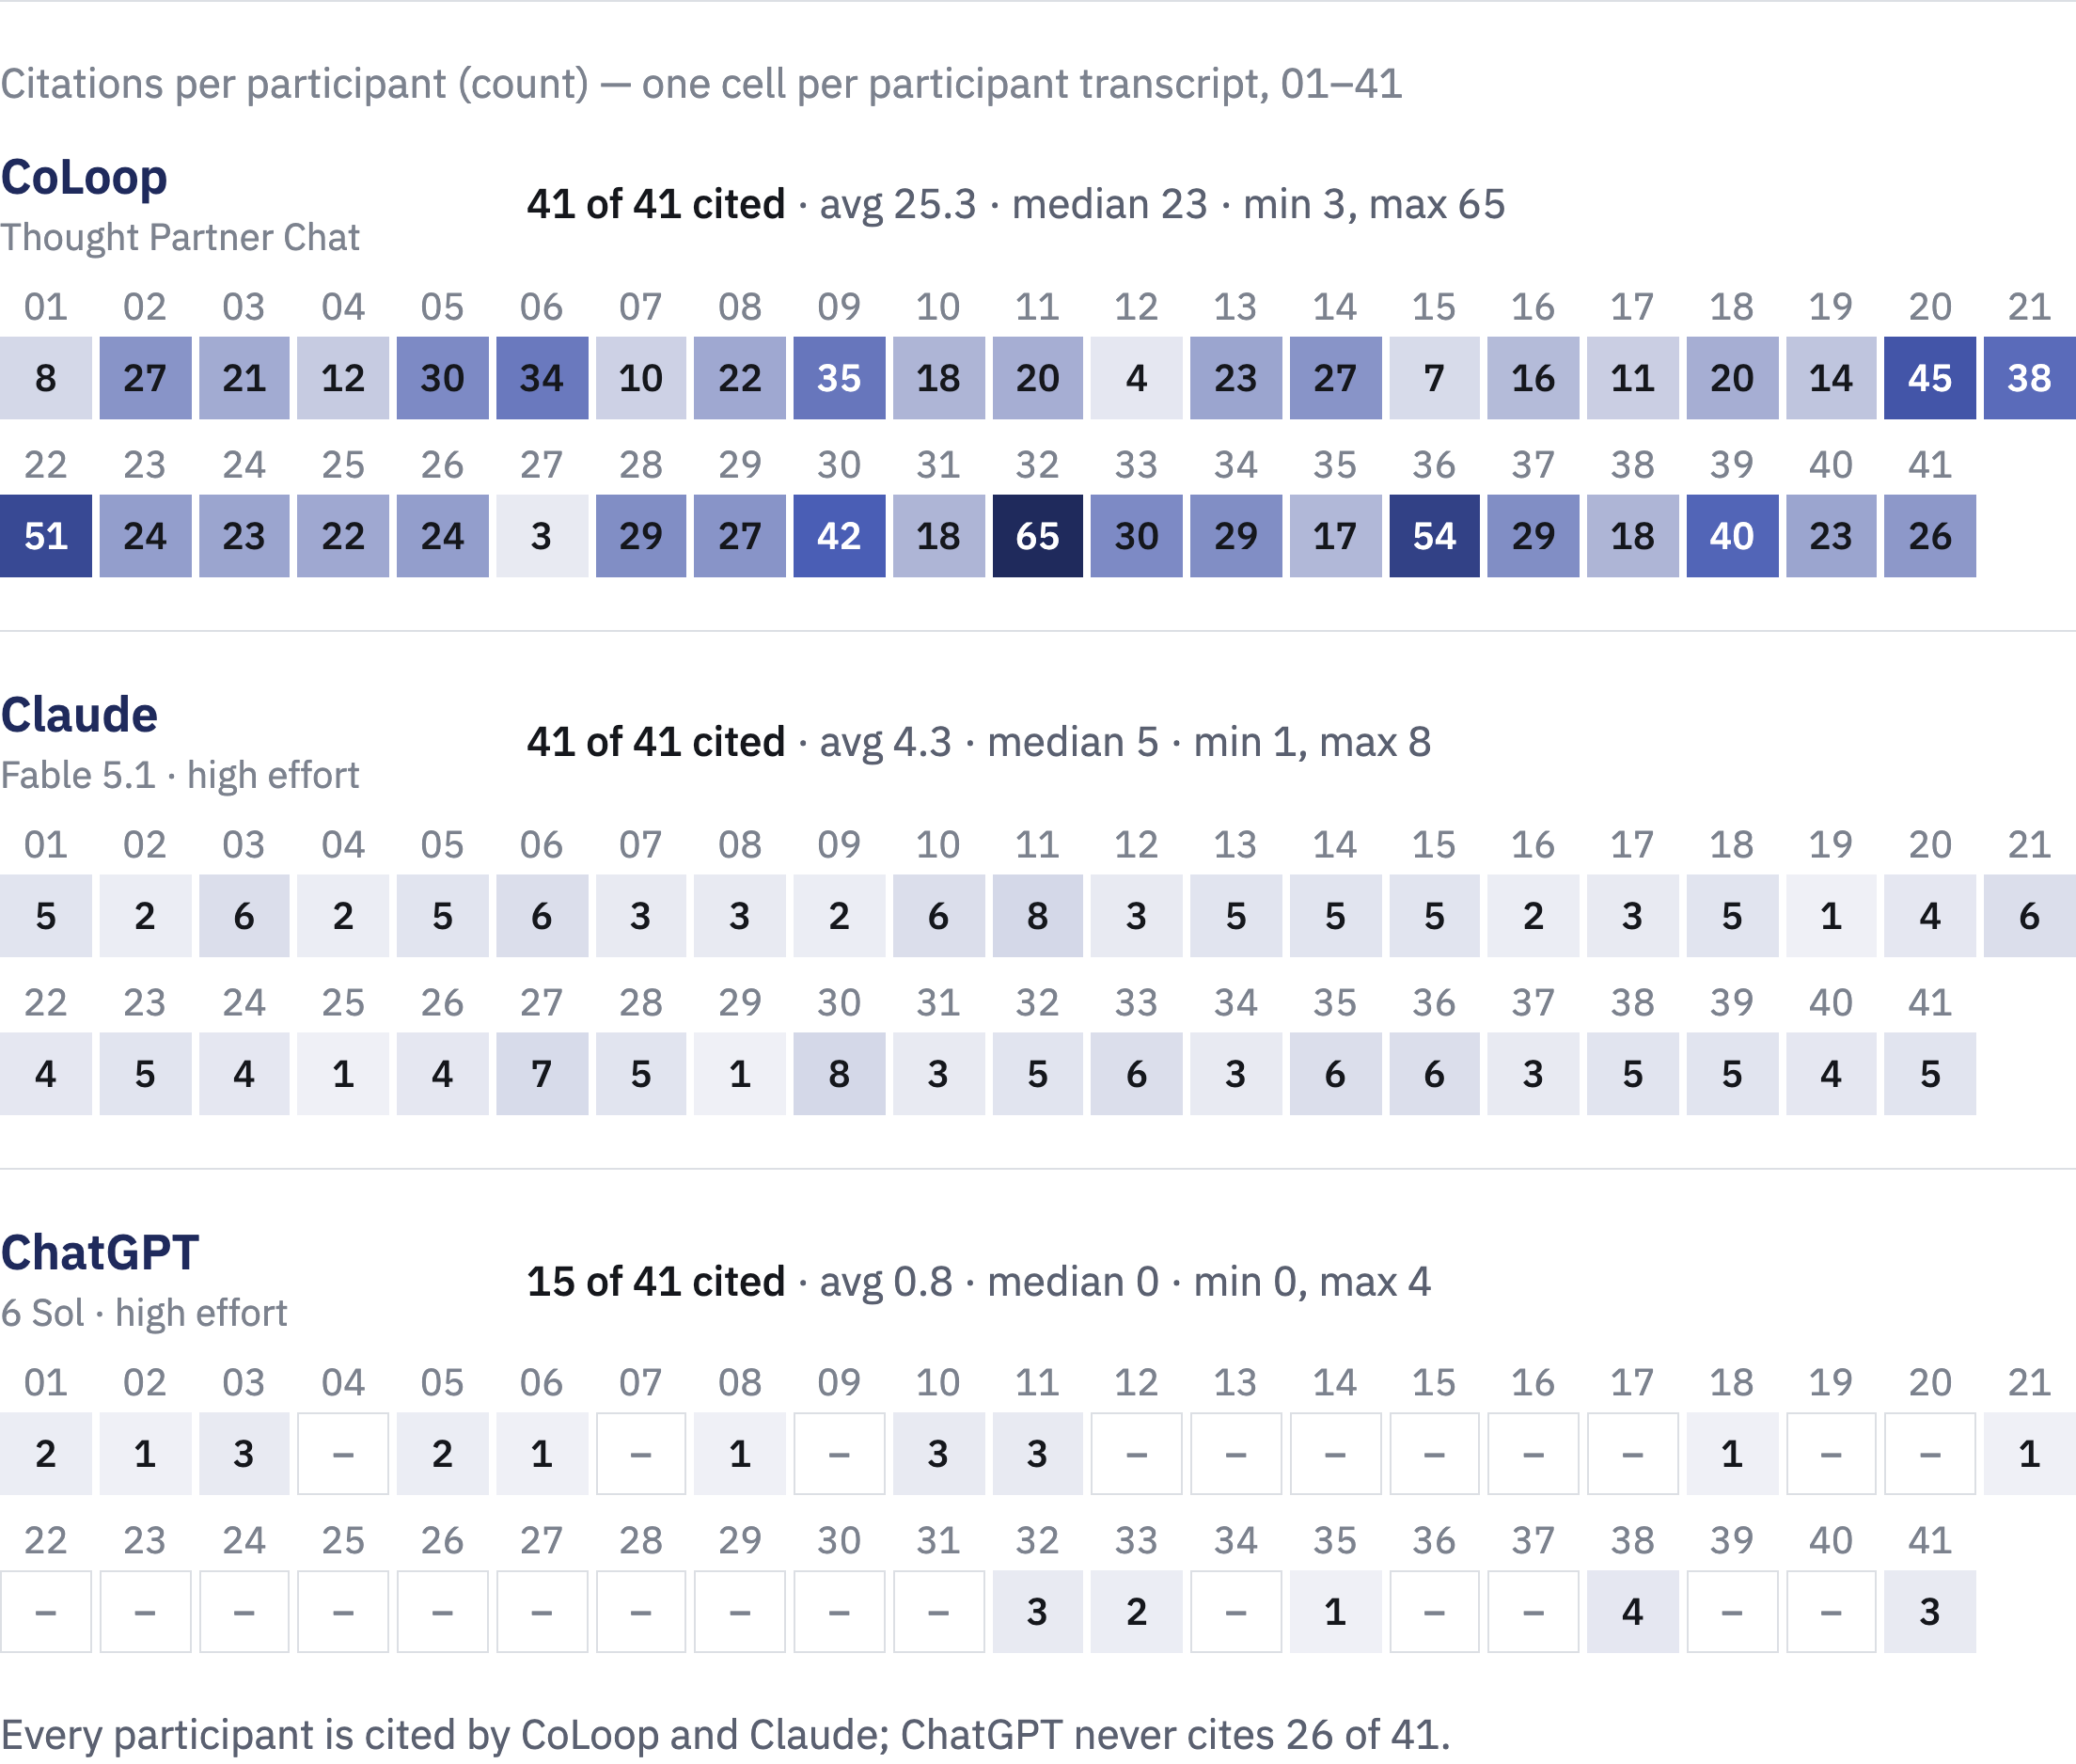
Rubric 2b. Distribution: did the agent over-index on a few participants?
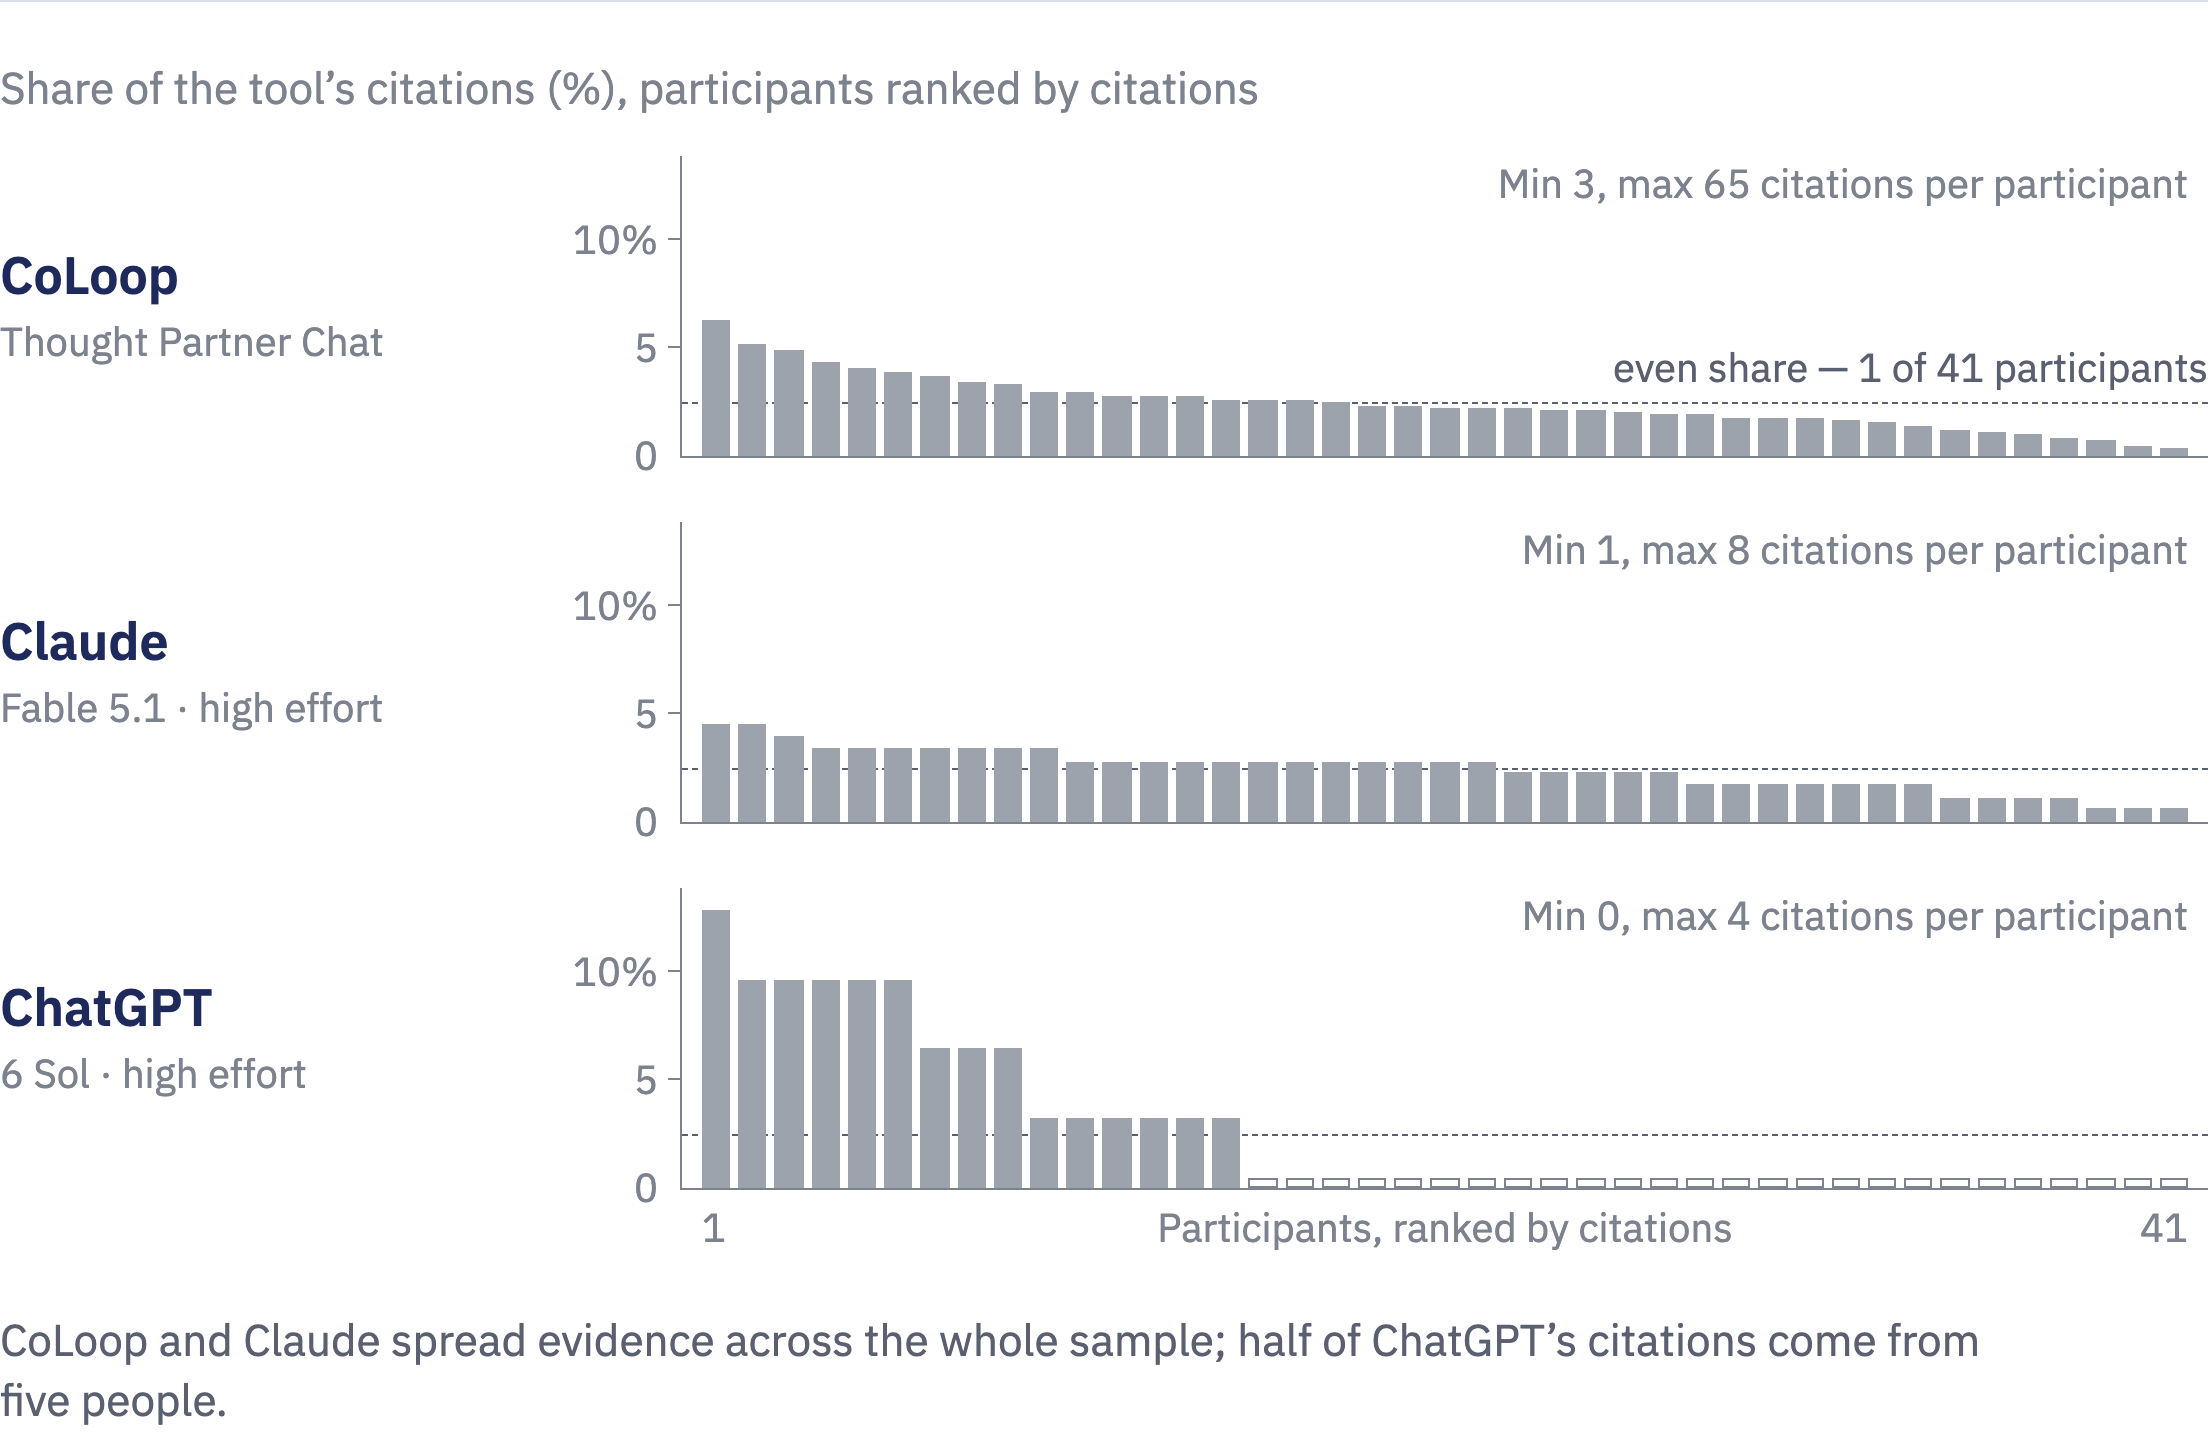
In this response, ChatGPT 6 Sol cited 15 of the 41 participants; the remaining 26 do not appear in the analysis at all, and six participants account for 61% of its citations. For a study that recruited and interviewed 41 people, the result is equivalent to having recruited 15: the majority of the sample had no effect on the findings, and it only reflected a small subset of voices.
Benchmark Layer 3. Prevalence Calibration
Is this insight important?
Prevalence governs the weight given to: each finding, the deck structure, and the researcher's credibility when a stakeholder probes the number behind an insight.
It is also where AI agents are least reliable. When a model synthesizes a claim, it loses track of the total number of participants, so prevalence claims like "the majority felt," "most participants reported" and "an edge case" are produced without reference to how many people were asked. This is one of the bottlenecks CoLoop has specifically engineered against.
Prevalence Calibration tests the result: for every claim that asserts how common something is, we check whether the participants cited for it cover the prevalence it asserts.
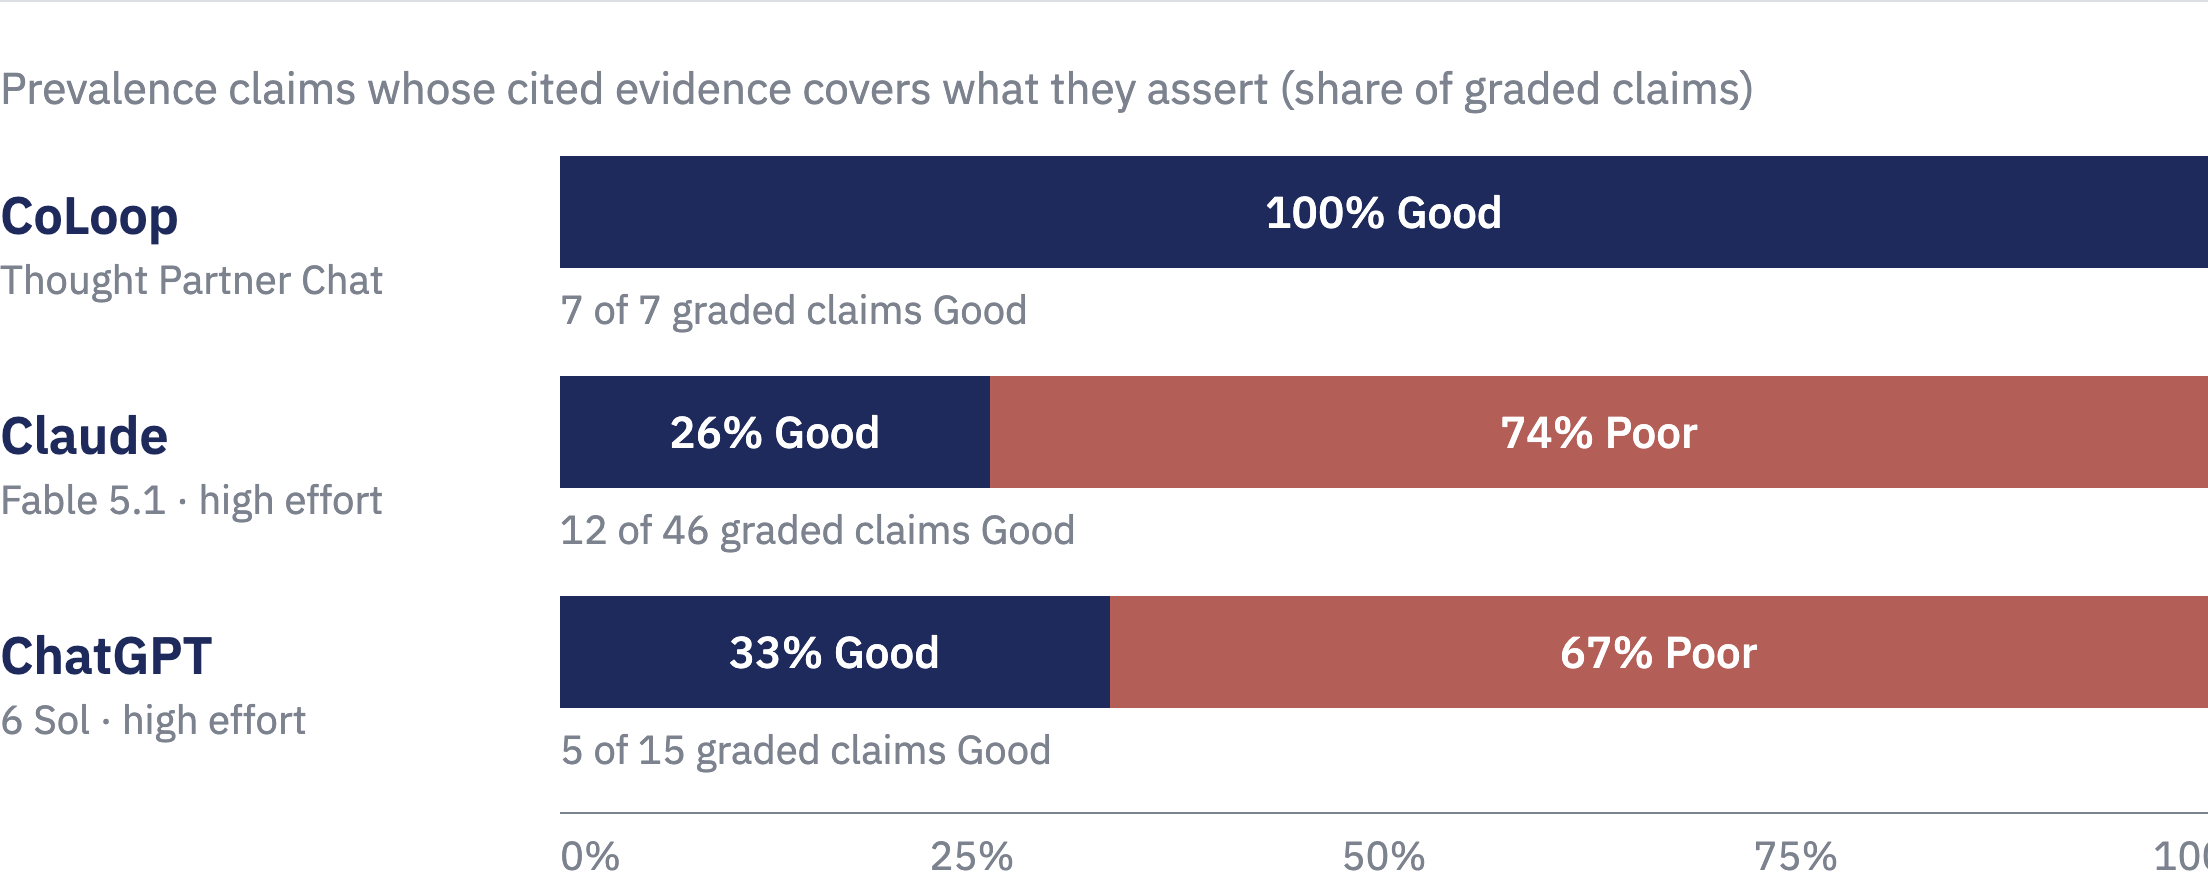
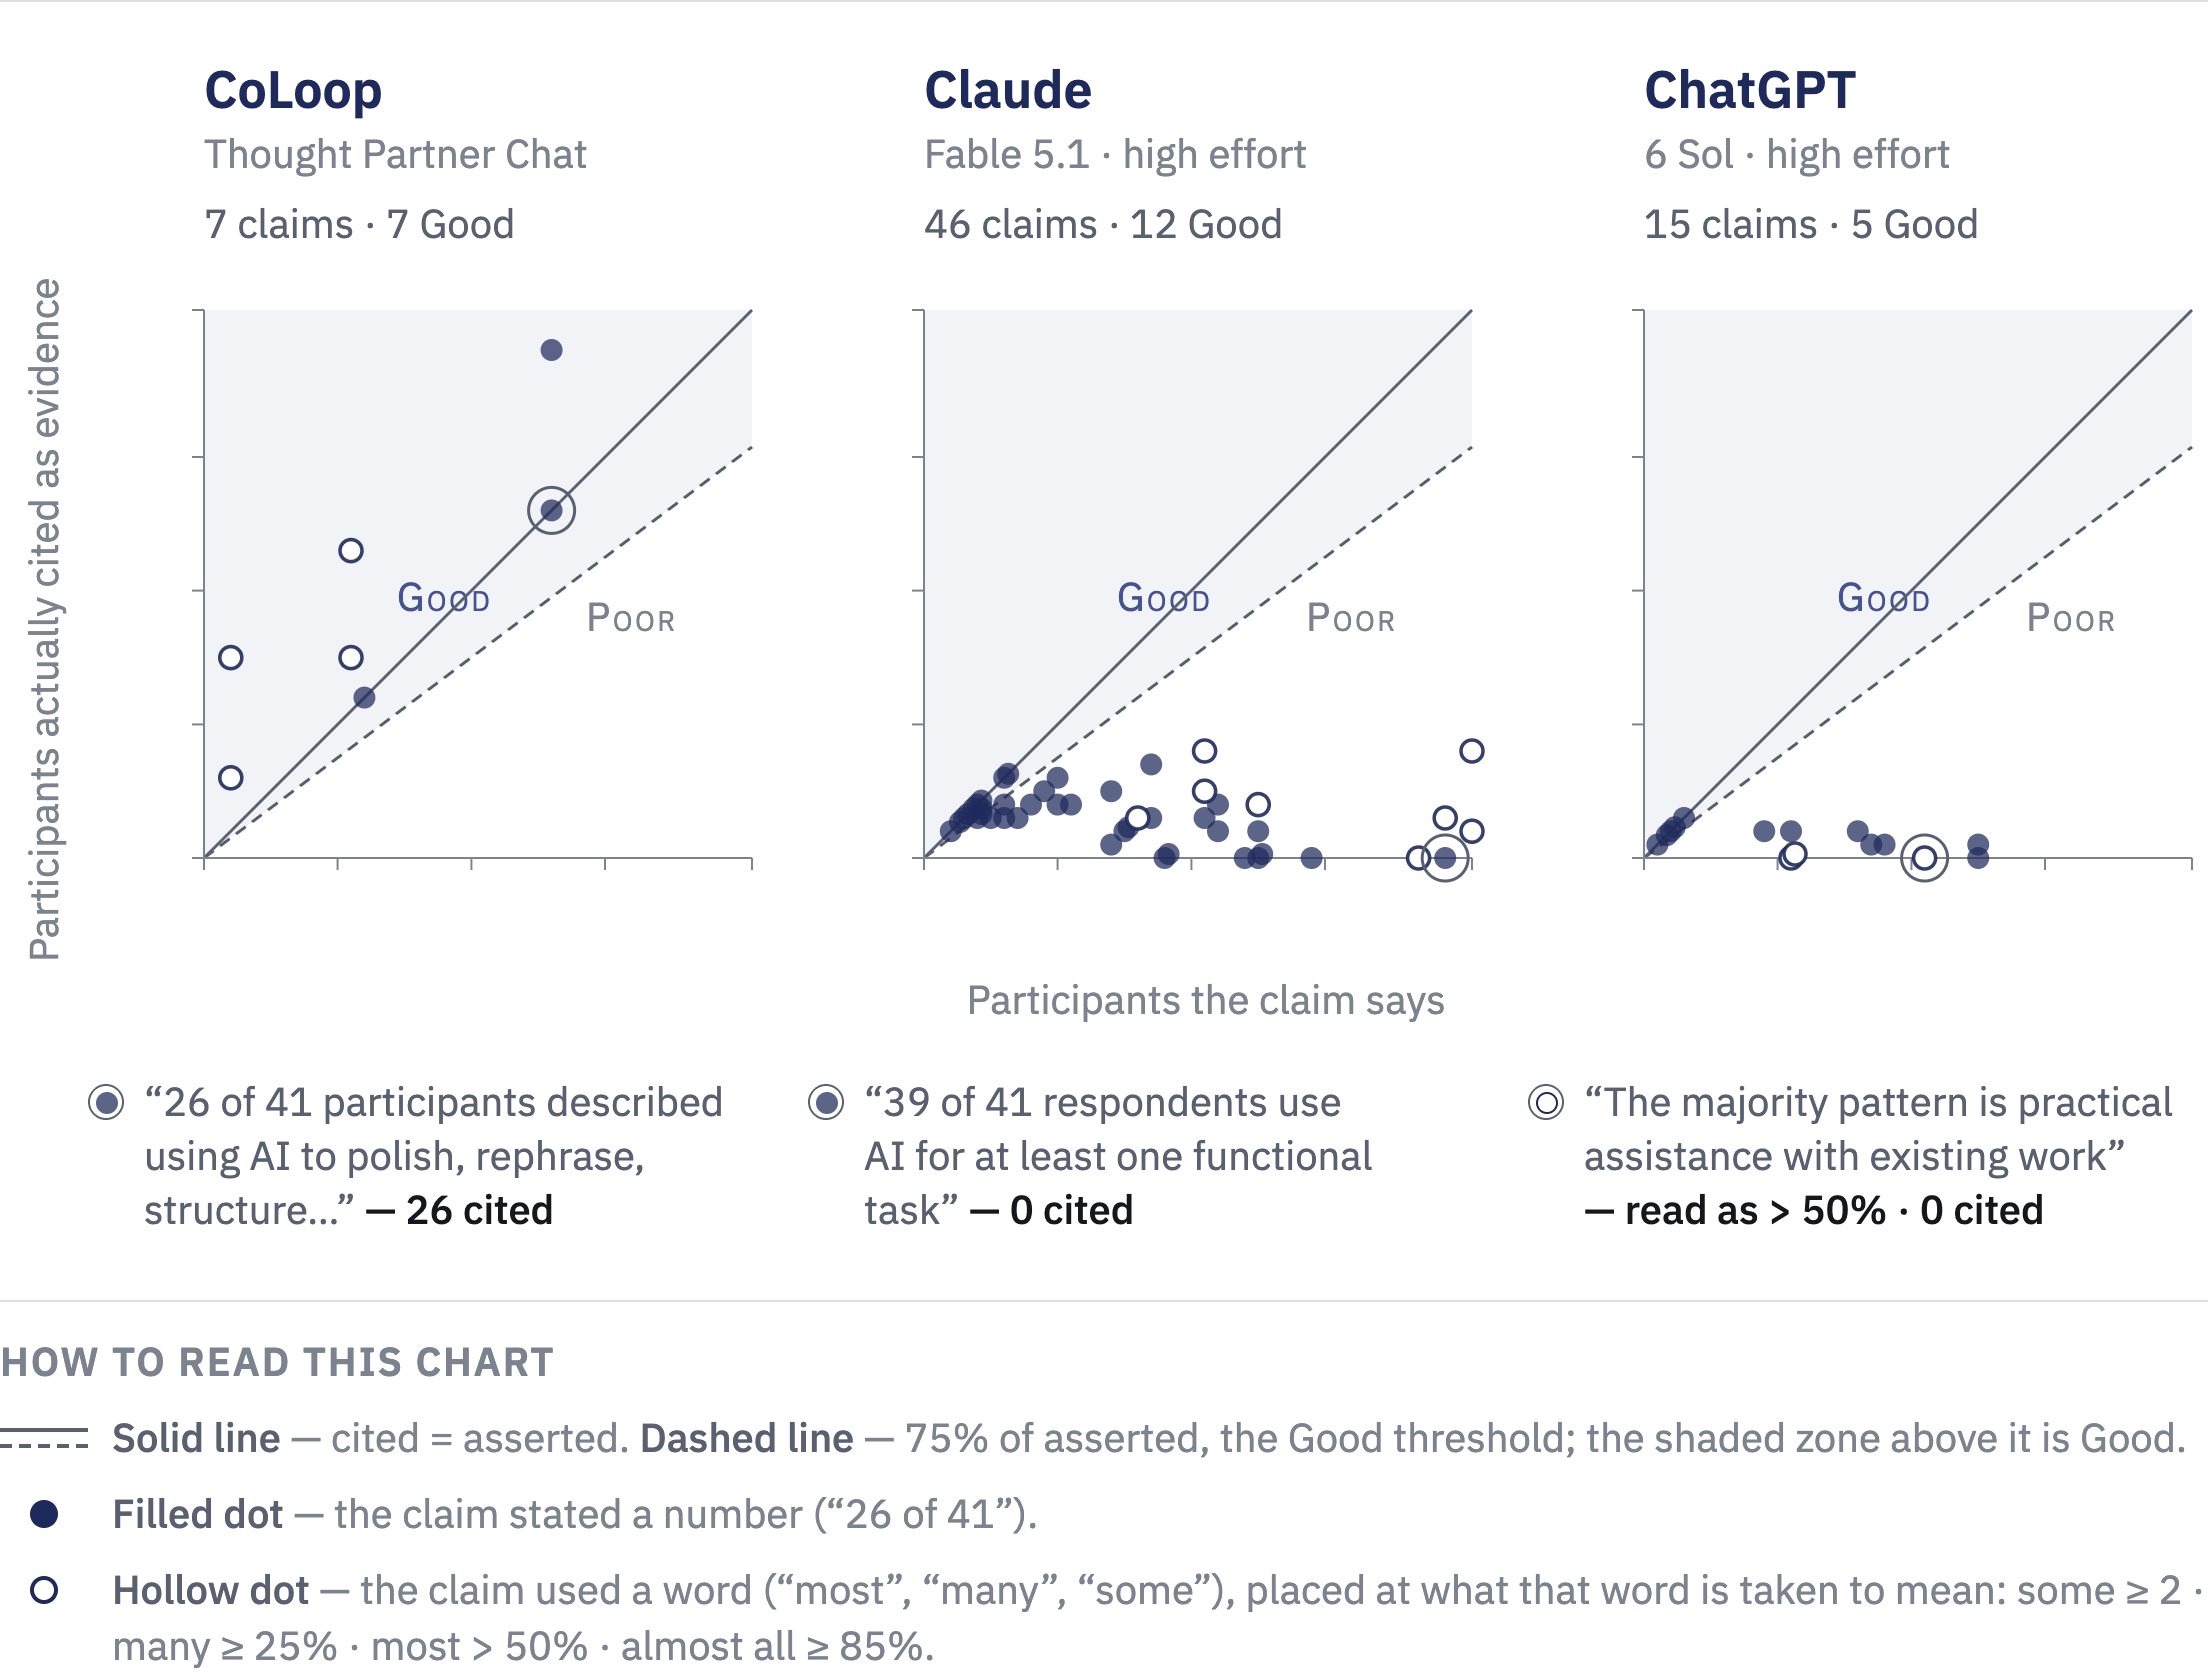
For the generic tools, 34 of Claude's 46 prevalence claims and 10 of ChatGPT's 15 claims lacked the cited support to stand behind them. A prevalence claim with no participants behind it cannot be trusted on its face, and verifying one means re-reading the transcripts, the same work the tool was meant to replace.
Coming Next
Generic AI tools have become good: the summary reads well, the themes seem plausible, and the numbers are often close to the hypothesis. However, for a researcher, that is not the same as a defensible insight. Across three layers, the benchmark shows where Claude and ChatGPT's output falls short.
This is the first report in our series. We have covered: a general analysis brief and the kinds of open questions asked at the start of a project on a single study of 41 interviews. Our future reports will apply the same benchmark to the work researchers spend most of their time on: concept testing, segment comparison, and studies with far larger samples, where coverage and prevalence are harder to get right.
Until then, the rubric is yours to use. For any AI output, ask where the evidence is, who in the sample is missing, and how many people really said it. If you would like to see the eval run on one of your own studies, send it to us.