Product Updates
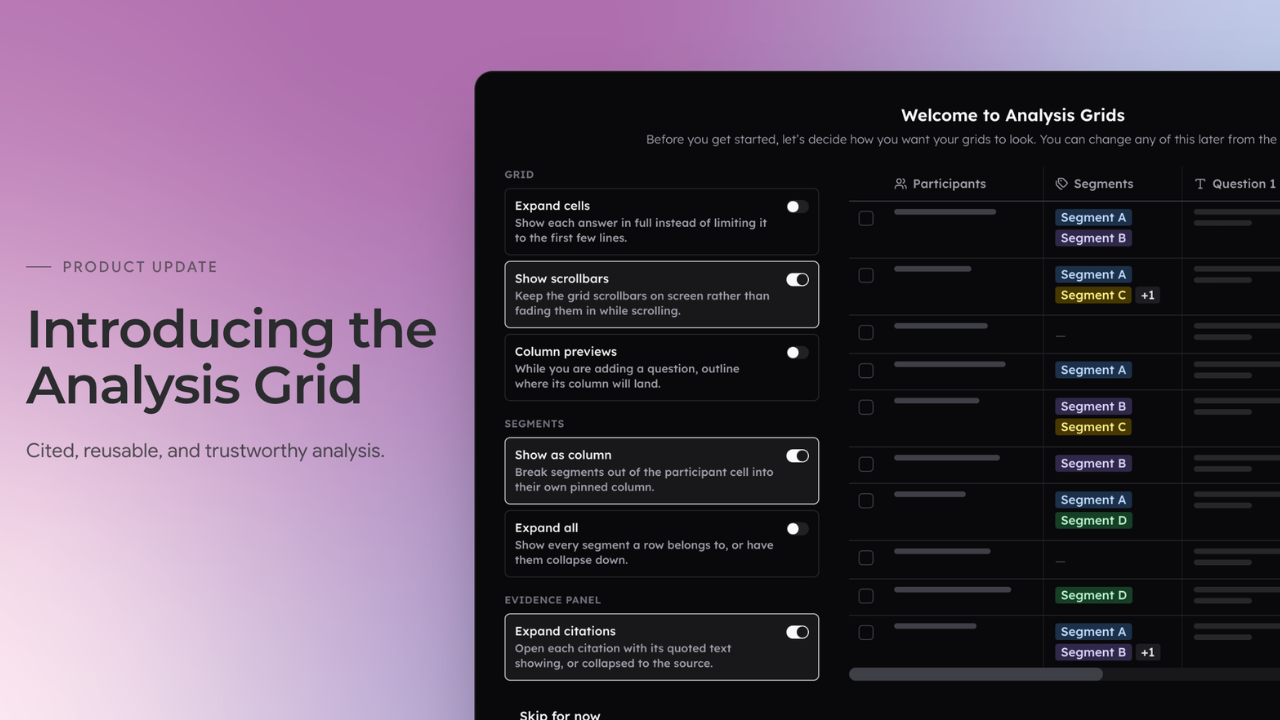
Introducing the new Analysis Grid
Discover how CoLoop rebuilt the Analysis Grid to deliver cited, reusable, and trustworthy analysis for researchers.
Jack Bowen, Co-Founder & CEO · · 5 minutes read
AI chats are great for ideation and generative search but they’re non-optimal as a primary UI for rigorous first layer research analysis.
Every company in the world right now is building a chatbot (we’re guilty as well … 🙋) but more and more modern teams, including the big labs, are moving past generic chat interfaces towards hybrid job task specific UIs and seeing better results. While AI chats are excellent for Socratic discourse and ideation, they fall down in the following ways when conducting first layer analysis:
- Chronological & Contextual Clutter: AI chats are difficult to context manage and become quickly cluttered with no effective way of branching, preserving or correcting specific responses.
- Non Composable; Non Reusable: Like Google search pages they’re a terrible way to persist information. They’re difficult to search and are best suited to more disposable interactions.
- Inherently Unstructured: Chat threads are dynamic and free flowing. This makes them excellent for exploring ideas but problematic for creating persistent research artifacts. Once they extend over a few exchanges, the full picture becomes difficult to see.
In order to address this, we’ve revamped our analysis grids with a full ground- up rebuild to help professional researchers achieve rigorous, cited and reusable analysis.
Why researchers start with an analysis grid
One shared source of truth across the team
Insight development passes through many hands: exploration, brainstorm, report, review. Every hand-off poses a risk of the analysis drifting. Throw non-deterministic AI into the mix and this problem gets 10 times worse. Each researcher gets a different perspective every time they query the dataset. What’s more, junior researchers or team members not present in the interview lack the prior knowledge to spot issues with outputs.
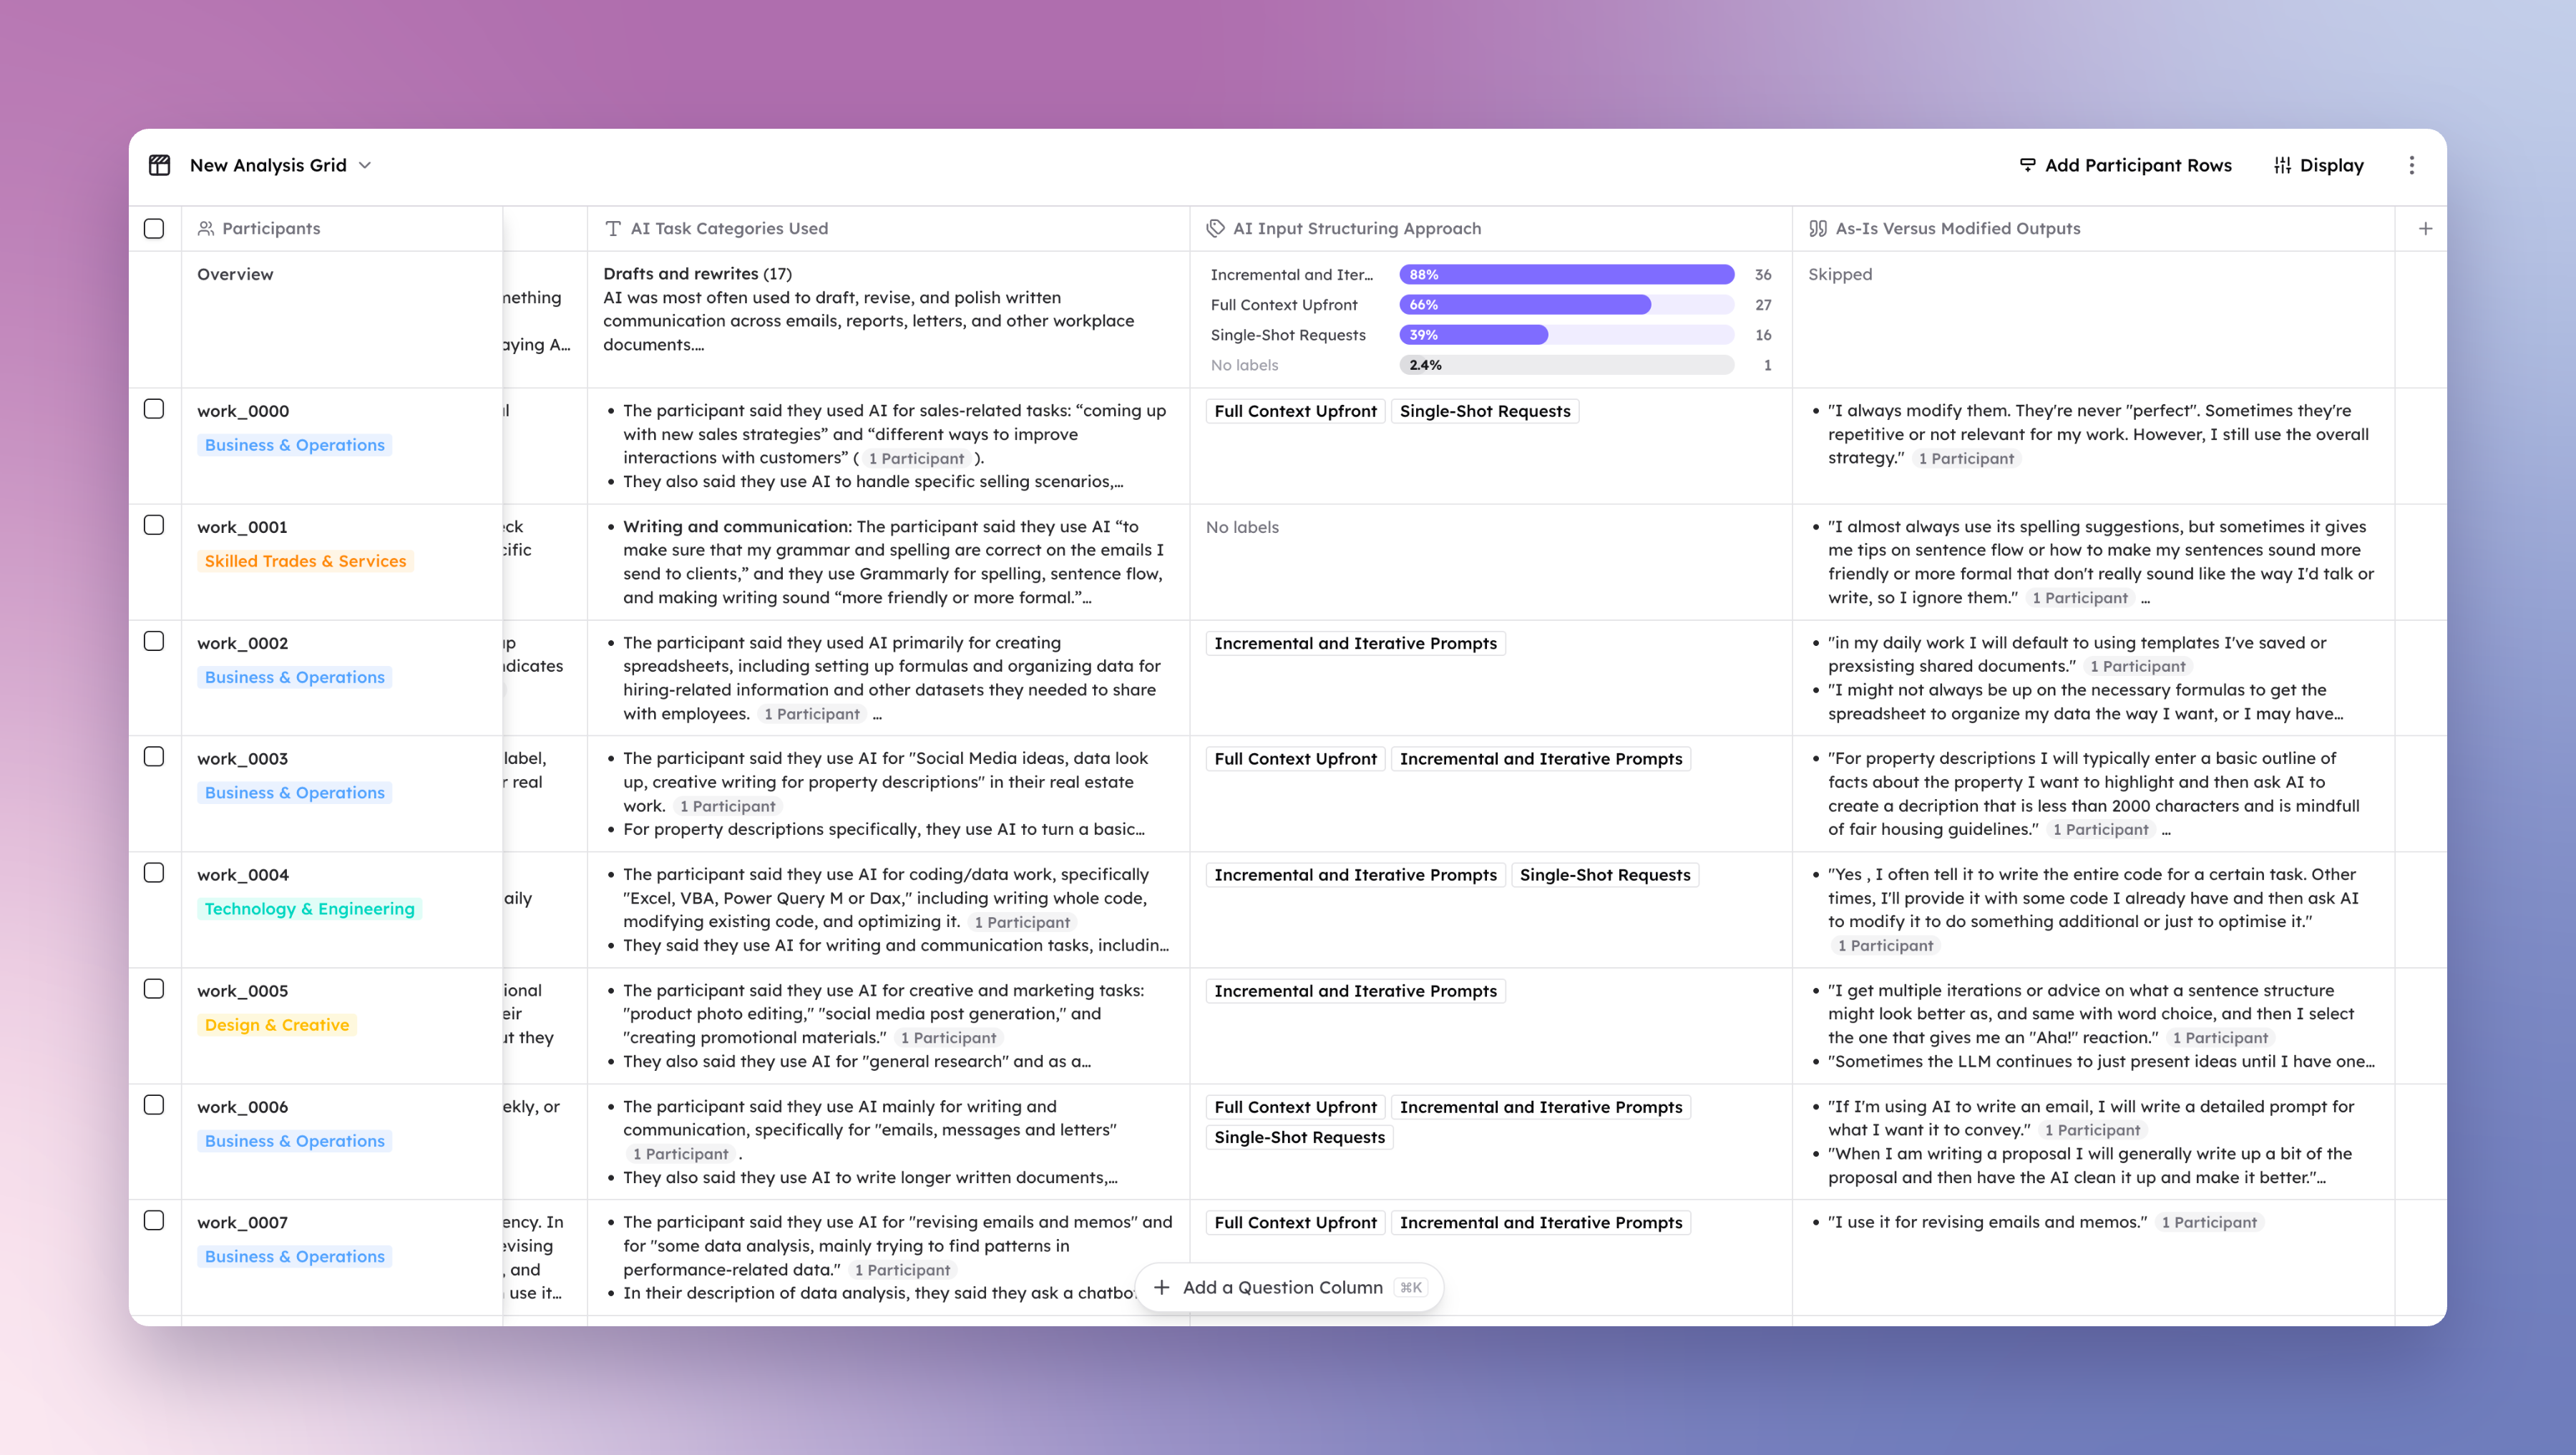
Our new analysis grid solves this by providing you with a central collaborative space that everyone on the team can see. All sources, prompts and responses are saved and retrieved if appropriate to keep the ground steady under your feet and everyone aligns on a consistent interpretation.
Understand the complete picture, faster
Fieldwork leaves every researcher with hypotheses and favourite respondents. Correcting the potential biases can be difficult if you need to read every full transcript. This is why a complete read of the data matters.
Our new grids lay out every participant against every question, and are the fastest, most trustworthy way to that complete picture: quicker than reading every transcript and more structured than a chat answer. Different views and templates are integrated into the analysis grid so you can quickly see breakdowns by participant, segment or concept.
Analysis that keeps pace with fieldwork
Everyone knows the feeling of rushing to the end of the project before coming up with that one question you wish you’d asked. What’s more, most teams still wait until the end to turn around a response. In today’s fast-moving world, early directional findings before the project is complete are becoming table stakes.
CoLoop’s new analysis grids by contrast are fully realtime. As your research evolves and new topics emerge, they keep you close to the data as it arrives. Each interview is mapped-in as it lands, giving you a running summary of every conversation against your research questions. Hypotheses form while the project is still in the field — early enough to test in the next session. By the time the field closes, the analysis is already under way.
(This works extremely well with our new meeting bot — details here).
Built for consistent comparison: segments and stimuli, side by side
When working across markets, segments or concepts, the non- deterministic nature of AI strikes again. Analysing different cuts of your participants results in differing results each time. This creates a shaky foundation on which to base your results.
We address this issue in our new analysis grids by saving every response and output and allowing you to reuse them across different cuts of your research data. Prompts can be copied across grids and individual responses retrieved seamlessly. Whether you're exploring responses to one concept at a time or comparing across the two, it rests on the same set of responses.
Why you can trust CoLoop Analysis Grid
The grid is the foundation researchers build insights on, so it has to meet the standard of your handmade grids. We have made improvements on consistency, data coverage, citation accuracy, analysis depth, usability, and precision. Here’s what that looks like.
Towards reliable AI: Ask the same question, get the same answer always
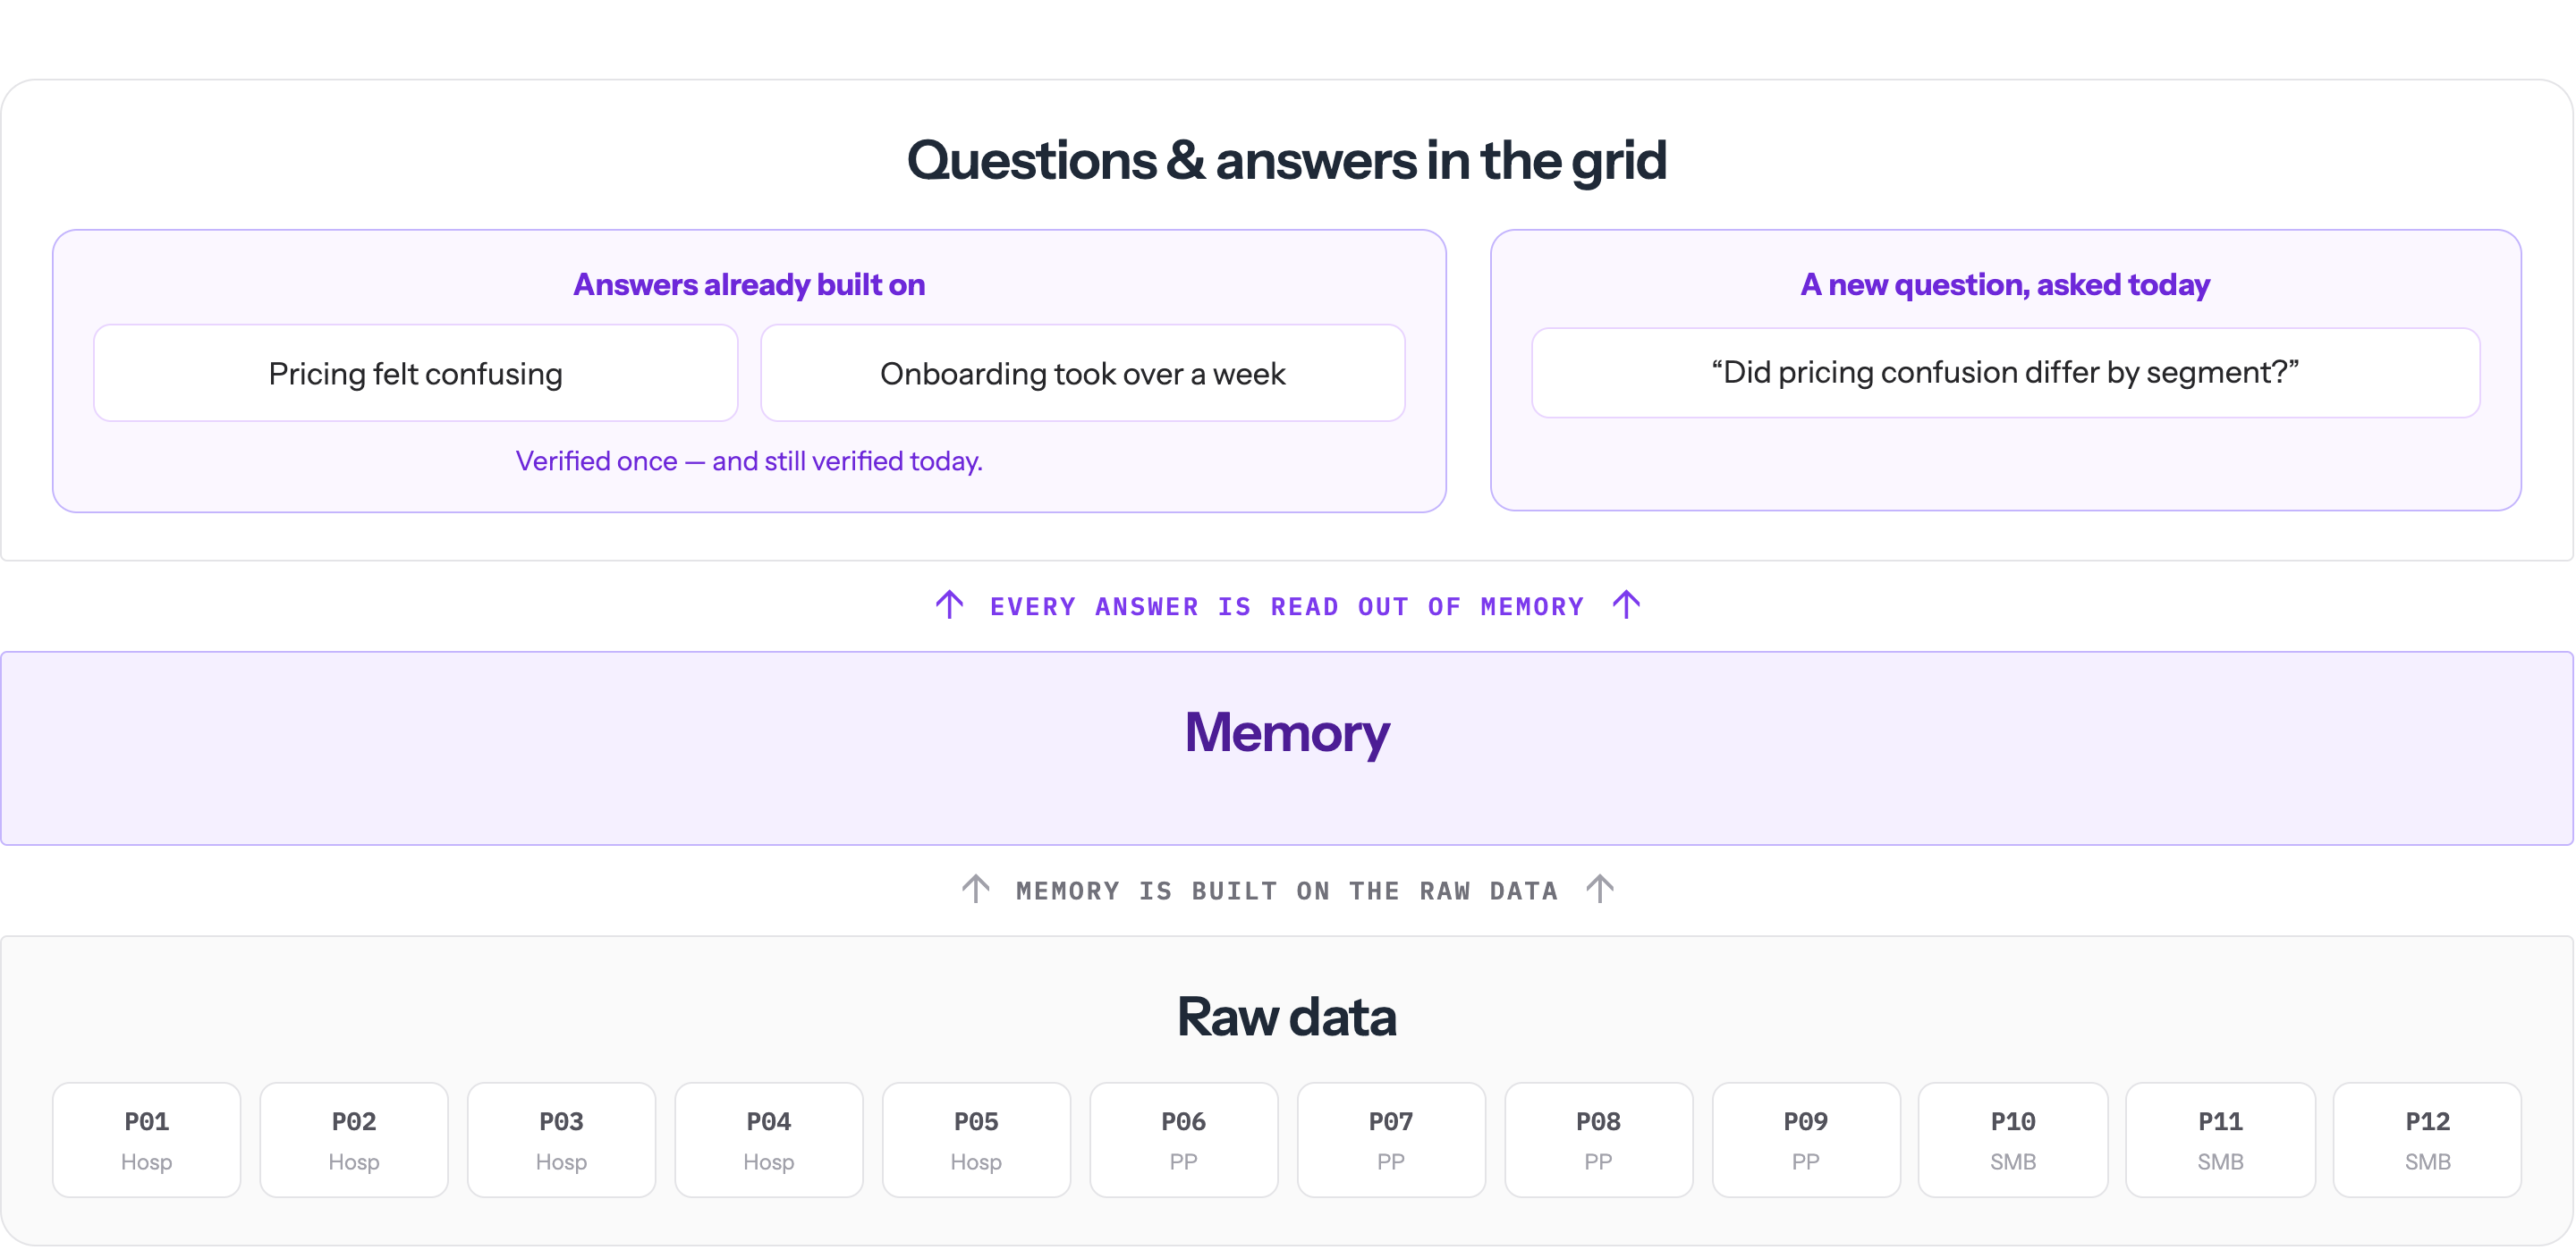
Low consistency and the impact it has on trust have been an AI industry bottleneck. AI is like a person with poor memory recall: every time you ask a question, it re-does the analysis from scratch and returns a slightly different answer. Reviewing becomes a moving target and up to chance. However sound the underlying analysis, an answer that changes on every ask feels unreliable, and is difficult to stand behind.
AI lacks long-term memory, so we built a memory layer within the CoLoop analysis grid.
The result is a grid that holds still: when a claim is questioned weeks later, you ask the grid and find the same answer you built on, and any cell you've verified stays verified.
Replacing Retrieval with Long Context Models for deeper nuance and detail
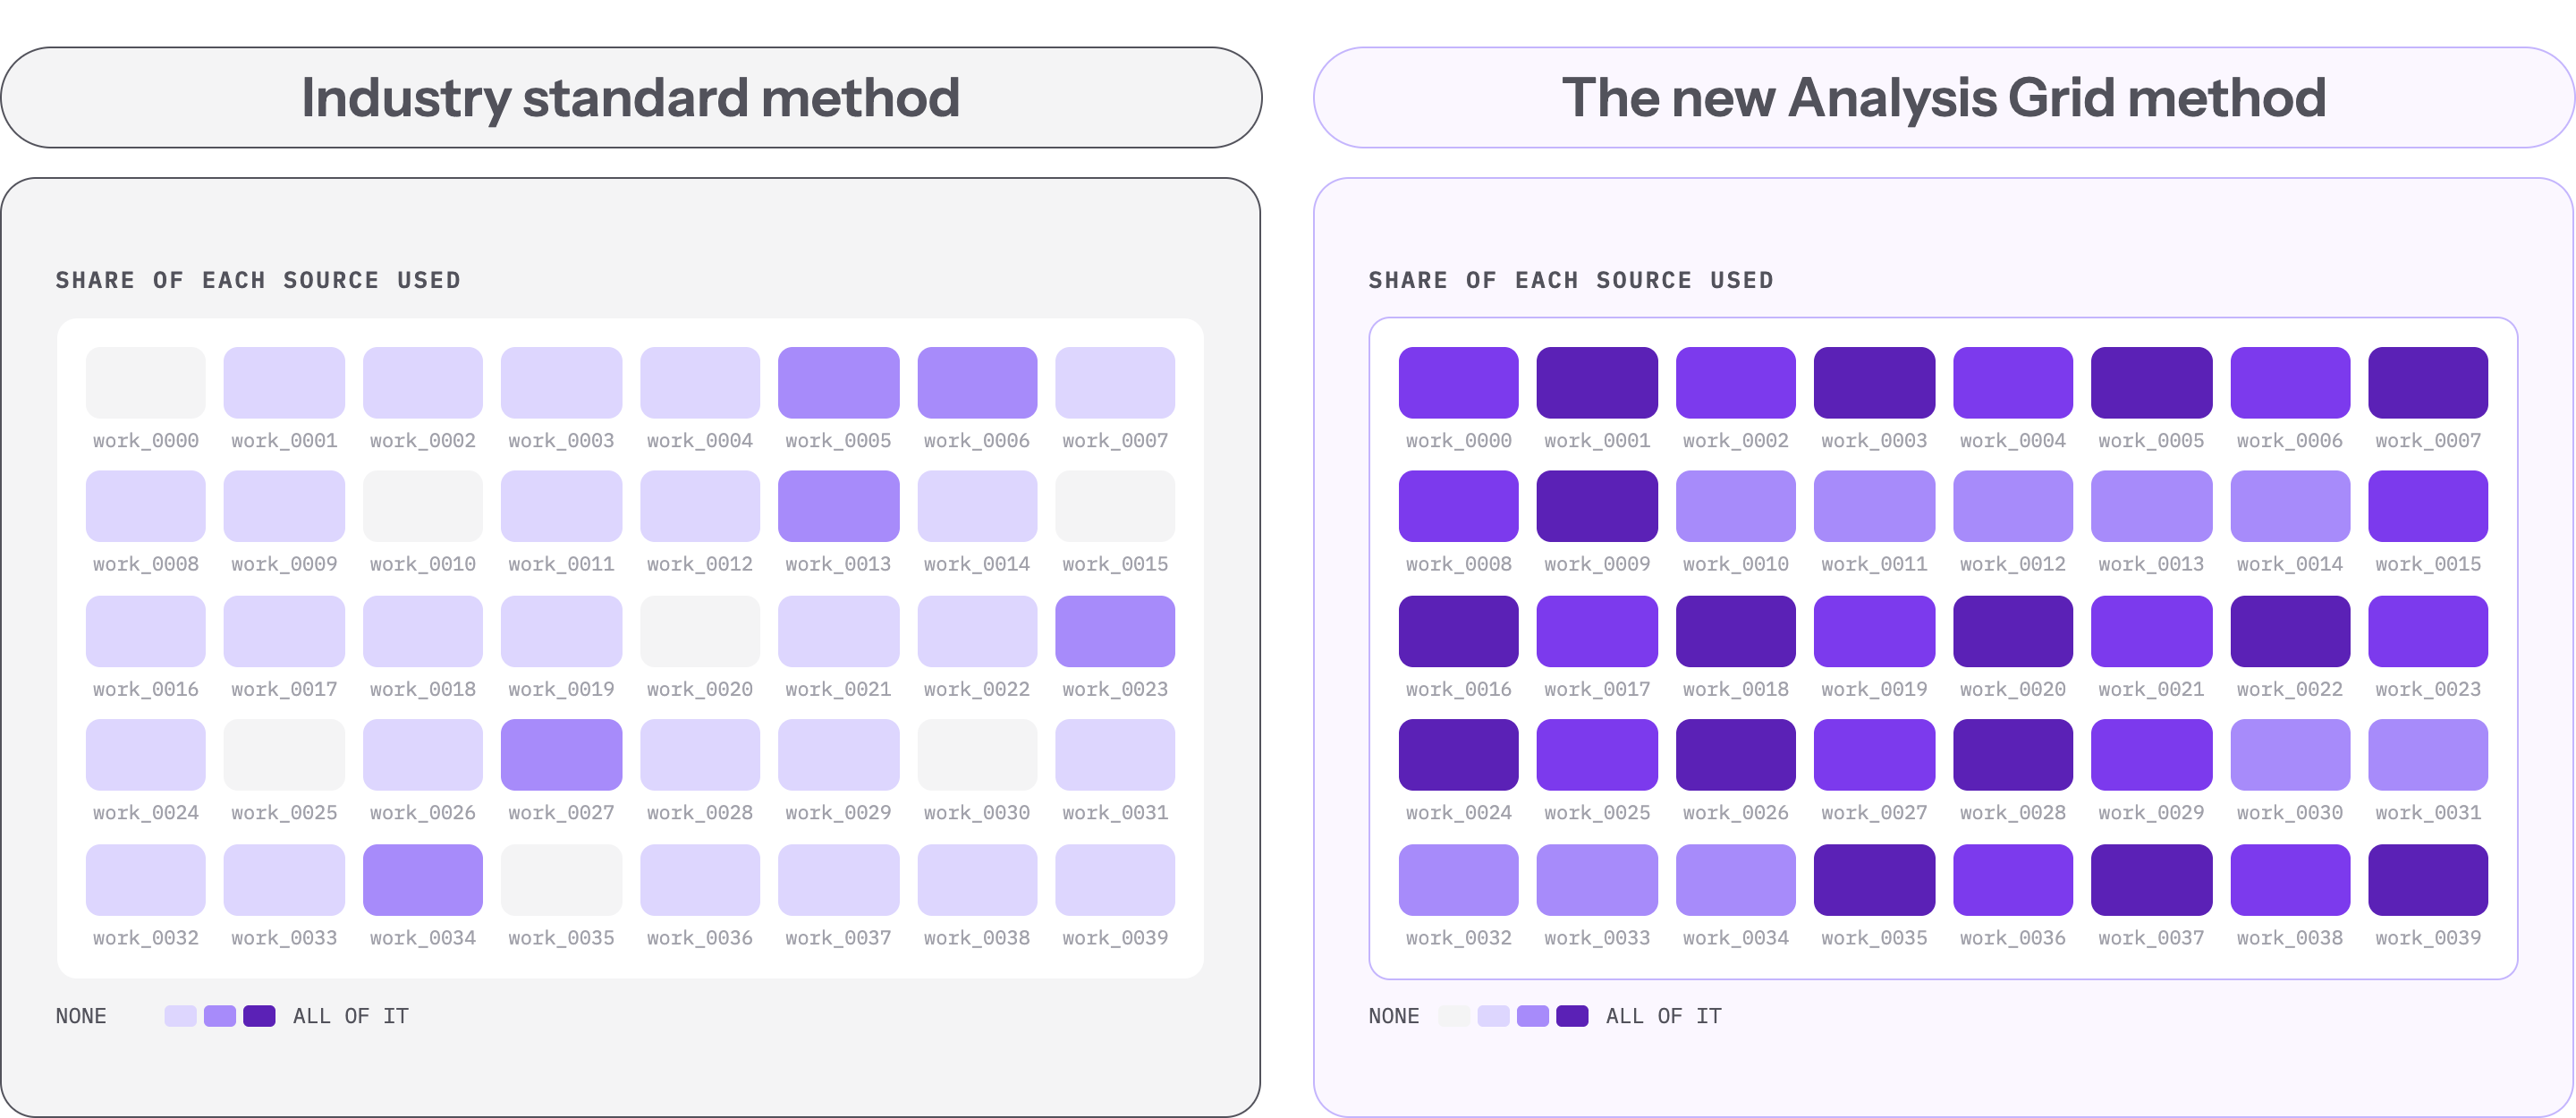
As a frontier AI company focused on qualitative research, our job is to push the cutting edge of technology to meet researchers' standards. Similar to projects in tools like Claude and ChatGPT, our first version of the analysis grid relied on retrieving and interpreting the excerpts and transcript segments most similar to the question being asked.
Despite the heavy optimisations made to tune this to complex domains, study types and scenarios, we ultimately found this approach plateaued when it came to dealing with complex questions that required full context or understanding of temporality in the interview e.g. Pre and Post Stimulus exposure.
Our new analysis grids make use of the latest fast long context models to reason over and consume entire sets of research material with pass. This approach consumes more than 3x as many tokens but in exchange preserves full details and reasoning chains that are exposed to the user. Outlying and nuanced points are extracted rather than being flattened into broad themes. This results in comprehensive, explaining analysis with linked citations and reasoning included.
Output types that fit your question, and a flexible UI that fits your workflow
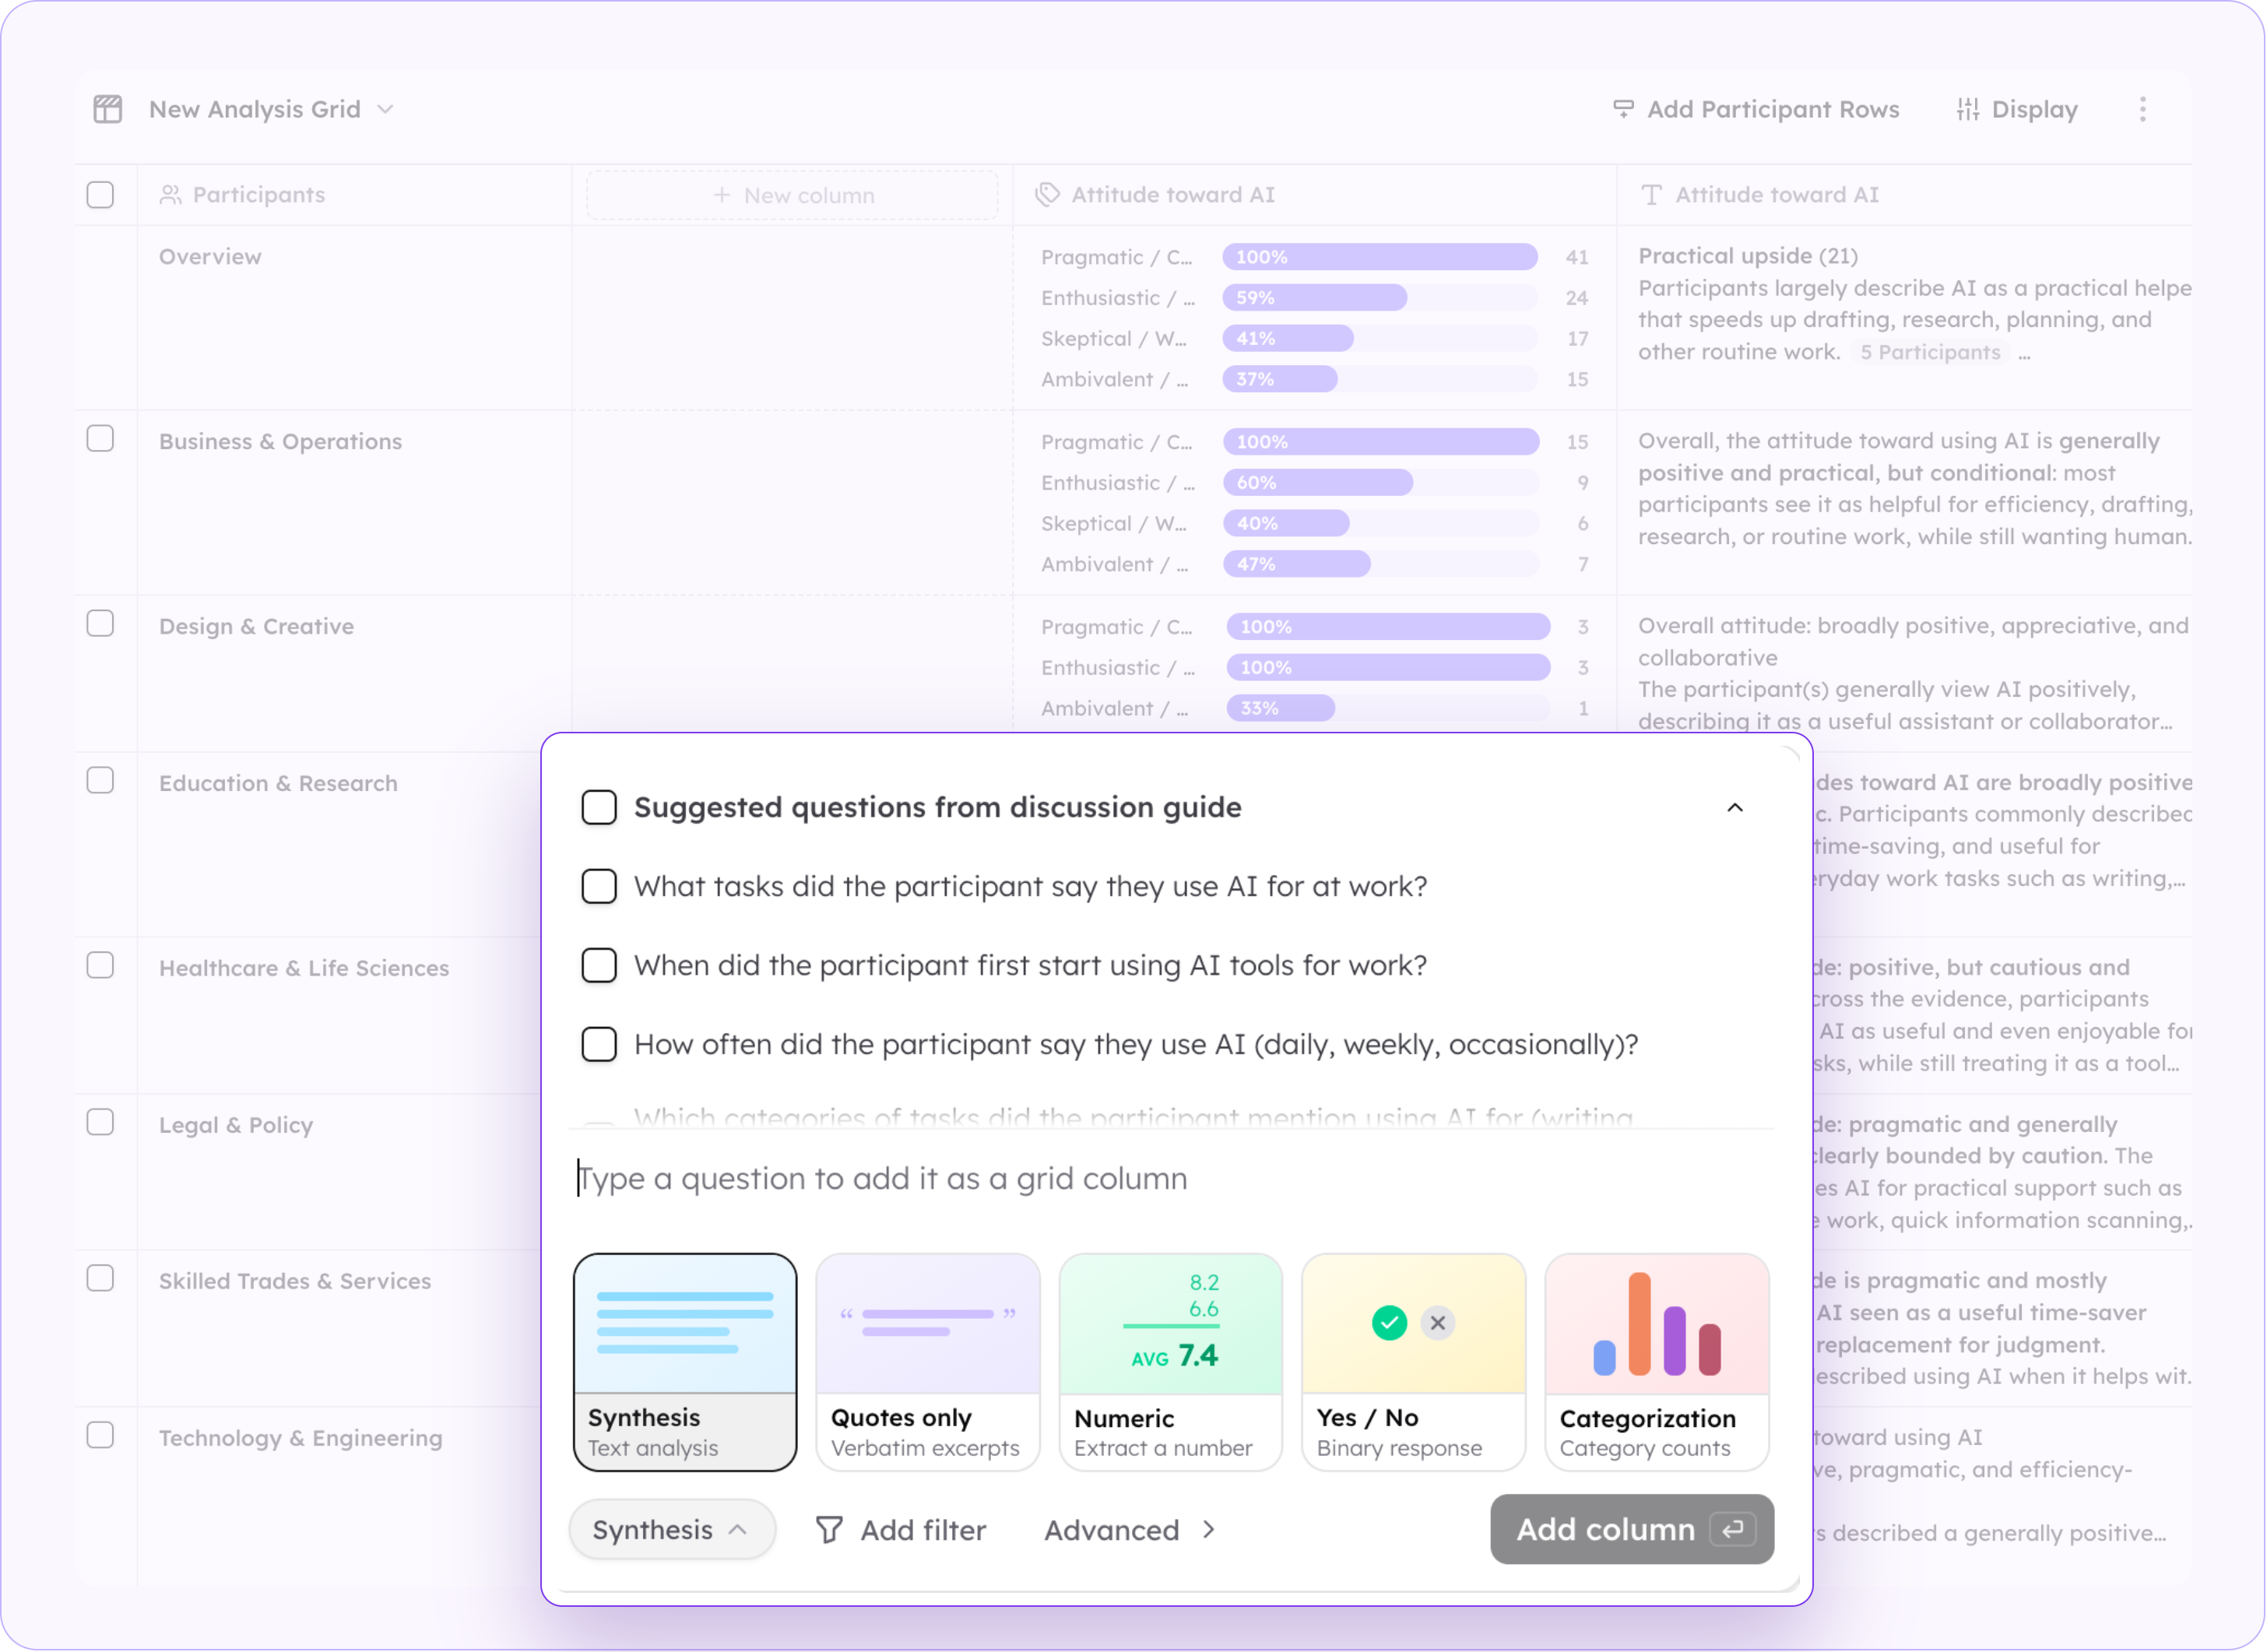
A grid holding this much information can easily feel like an overload. The new Analysis Grid solves this by letting each column return the output type that fits your question. The types include:
- Synthesised text analysis
- Verbatim Quotes
- Numeric Outputs for Ratings / Likert Scores
- Yes/No with Counts
- Coded Categories with Counts
Ask for what you need and get exactly that along with the explainable reasoning behind any assigned codes or counts. The result is a grid you can actually take in at a glance: patterns surface immediately, and the detail is one click away when you need to go deeper.
The new grid is also far more flexible to work with. Clone past grids or columns to reuse a structure, build question columns straight from your discussion guide or from suggested questions, reorder columns as your analysis takes shape, and filter rows by their answers to focus on the participants that matter to the question at hand. When you want the person-by-person view, one click on the participant will give you an overview that gathers everything an individual said in one place.
Transcript section-scoped analysis designed for precision
Some questions only make sense inside a specific part of the interview. Comparing spontaneous reactions against prompted ones or analyzing awareness before any stimulus was shown. Ask a typical AI tool, and it won't respect the boundary, it pulls from the entire interview, and reactions from after the reveal bleed into your "unprompted" answer.
When you build a question column from a question “extracted” from your discussion guide, the grid locates that exact conversation in every transcript — even when the moderator phrased it differently in the room — and answers using only the segment where it was actually discussed. Nothing bleeds in from similar questions elsewhere in the interview. Your spontaneous stays spontaneous, your pre-stimulus stays pre-stimulus, and the comparison you designed the guide around is the comparison you get.
The accuracy and reliability improvements to the Thought Partner Chat have been extended to the grid. Read the Thought Partner Chat blog post for more.
Try it now
The new Analysis Grid is live for every CoLoop user now. Here are some tips to use it well.
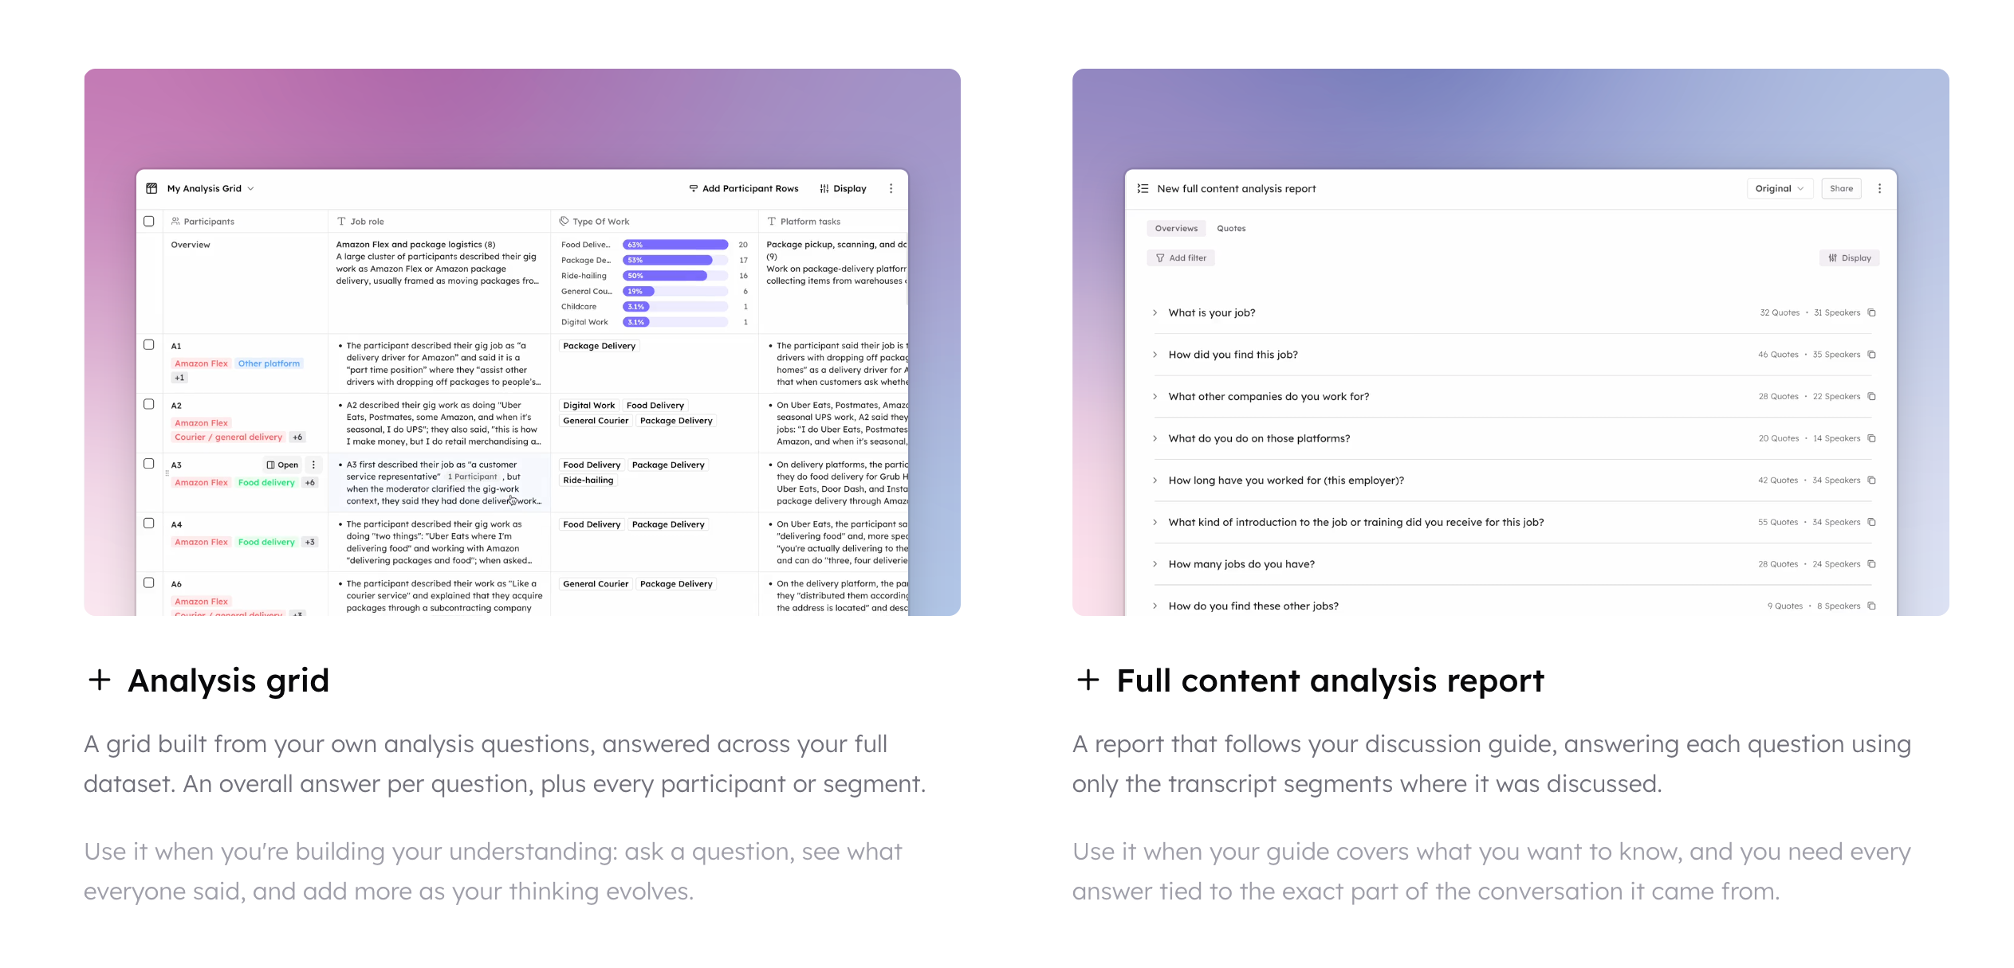
Grid or Content Analysis?
The Analysis Grid is more flexible. You can ask your own questions beyond the guide, and add or re-ask questions at any time as your understanding evolves. The format bends too: move, edit, and filter the view as you need.
Content Analysis Report is a report structured around your discussion guide, where every question is answered using only the transcript segments where it was actually discussed. Use it when you want your discussion guide to drive the report, with answers scoped to the relevant part of each transcript.
Start the team there
We recommend teams start in the grid. It keeps the rigorous process while saving the time that used to go into assembling it by hand. Form initial insights in the Analysis Grid or Content Analysis Report, then dive deeper with the Thought Partner Chat.
We’re continuing to build
Concept testing will no longer require color tags. Research Skills will support workflows for specific methodologies. And a research planning tool will support your insight journey from day one.